
Backbone API로 비전 모델 학습하기
Backbone API로 비전 모델 학습하기 (Training Vision Models using Backbone API)
컴퓨터 비전 워크플로는 공통된 패턴을 따라요. 특징 추출(feature extraction)에 사전 훈련된 backbone을 사용하고 (ViT, DINOv3), 특징을 강화하기 위해 "neck"을 추가하며, 작업별 헤드(task-specific head)를 붙여요 (DETR은 객체 탐지, MaskFormer은 세그멘테이션용).
출처: 문서
본문
Transformers 라이브러리는 이러한 모델들을 구현하고 있으며, backbone API를 사용하면 최소한의 코드로 서로 다른 backbone과 헤드를 교체할 수 있어요.
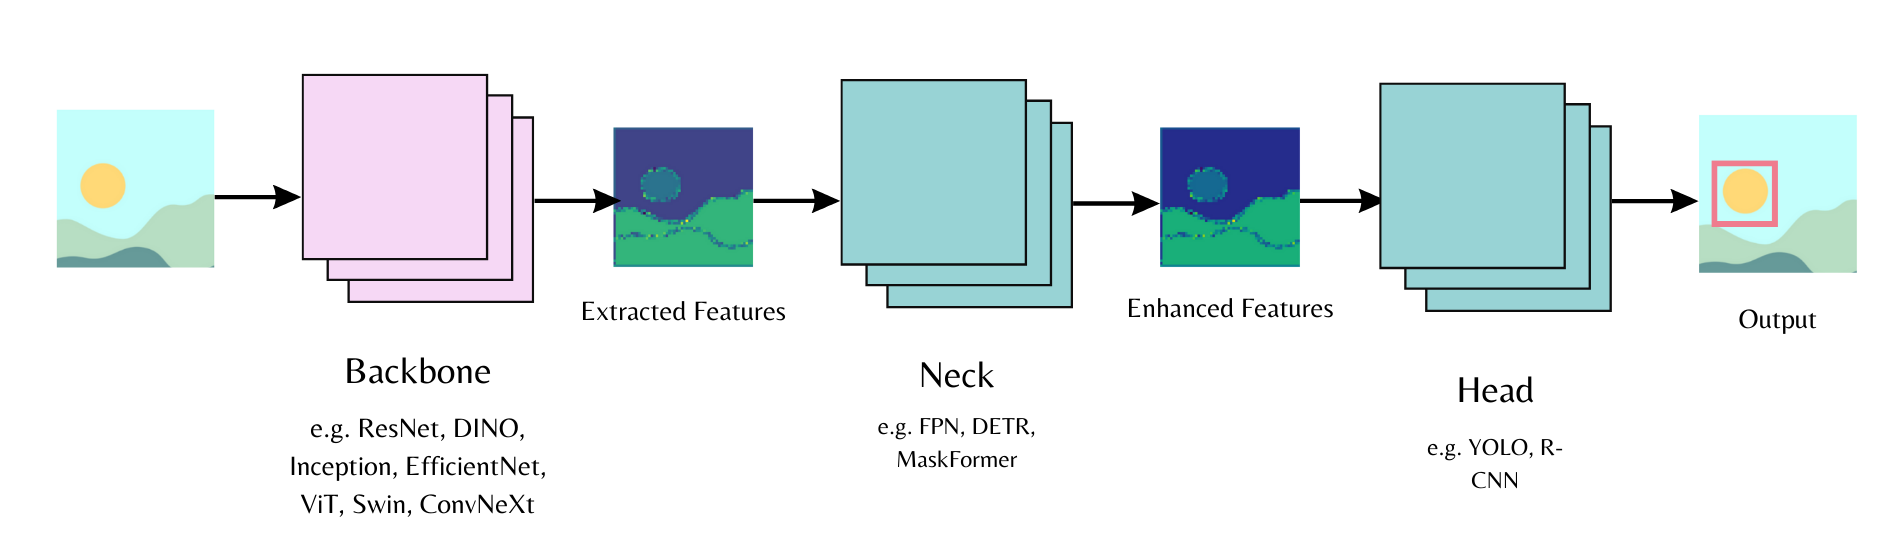
이 가이드는 ConvNext 아키텍처를 사용하는 DINOv3와 DETR 헤드를 결합해요. 번호판 감지 데이터셋에서 학습할 거예요. 글을 쓰는 시점 기준으로 DINOv3가 가장 좋은 성능을 보여줘요.
[!NOTE] 이 모델은 액세스 승인이 필요해요. 액세스를 요청하려면 모델 저장소를 방문하세요.
실험 추적을 위해 trackio를, 데이터 증강을 위해 albumentations을 설치해요. 최신 transformers 버전을 사용하세요.
pip install -Uq albumentations trackio transformers datasets
사전 훈련된 DINOv3 ConvNext backbone으로 DetrConfig를 초기화해요. 번호판 경계 상자(bounding box)를 감지하려면 num_labels=1을 사용해요. 이 구성으로 DetrForObjectDetection을 만들어요. 가중치를 갱신하지 않고 DINOv3의 특징을 보존하려면 backbone을 동결(freeze)해요. DetrImageProcessor를 로드해요.
from transformers import DetrConfig, DetrForObjectDetection, AutoImageProcessor

# Create a model with randomly initialized weights
backbone_config = AutoConfig.from_pretrained("facebook/dinov3-convnext-large-pretrain-lvd1689m")
backbone = AutoBackbone.from_pretrained("facebook/dinov3-convnext-large-pretrain-lvd1689m")

config = DetrConfig(backbone_config=backbone_config,
                    num_labels=1, id2label={0: "license_plate"}, label2id={"license_plate": 0})
model = DetrForObjectDetection(config)

# Assign pretrained backbone checkpoint and freeze the weights
model.model.backbone = backbone
model.model.freeze_backbone()

image_processor = AutoImageProcessor.from_pretrained("facebook/detr-resnet-50")
데이터셋을 로드하고 학습용으로 나눠요.
from datasets import load_dataset
ds = load_dataset("merve/license-plates")
ds = ds["train"]

ds = ds.train_test_split(test_size=0.05)
train_dataset = ds["train"]
val_dataset = ds["test"]
len(train_dataset)
# 5867
데이터셋을 증강해요. 이미지를 최대 크기로 리스케일하고, 뒤집고, 아핀(affine) 변환을 적용해요. 잘못된 경계 상자를 제거하고 rebuild_objects로 어노테이션이 깨끗하게 유지되도록 해요.
import albumentations as A
import numpy as np
from PIL import Image

train_aug = A.Compose(
    [
        A.LongestMaxSize(max_size=1024, p=1.0),
        A.HorizontalFlip(p=0.5),
        A.Affine(rotate=(-5, 5), shear=(-5, 5), translate_percent=(0.05, 0.05), p=0.5),
    ],
    bbox_params=A.BboxParams(format="coco", label_fields=["category_id"], min_visibility=0.0),
)

def train_transform(batch):
    imgs_out, objs_out = [], []
    original_imgs, original_objs = batch["image"], batch["objects"]

    for i, (img_pil, objs) in enumerate(zip(original_imgs, original_objs)):
        img = np.array(img_pil)
        labels = [0] * len(objs["bbox"])

        out = train_aug(image=img, bboxes=list(objs["bbox"]), category_id=labels)

        if len(out["bboxes"]) == 0:
            imgs_out.append(img_pil) # if no boxes left after augmentation, use original
            objs_out.append(objs)
            continue

        H, W = out["image"].shape[:2]
        clamped = []
        for (x, y, w, h) in out["bboxes"]:
            x = max(0.0, min(x, W - 1.0))
            y = max(0.0, min(y, H - 1.0))
            w = max(1.0, min(w, W - x))
            h = max(1.0, min(h, H - y))
            clamped.append([x, y, w, h])

        imgs_out.append(Image.fromarray(out["image"]))
        objs_out.append(rebuild_objects(clamped, out["category_id"]))

    batch["image"] = imgs_out
    batch["objects"] = objs_out
    return batch

def rebuild_objects(bboxes, labels):
    bboxes = [list(map(float, b)) for b in bboxes]
    areas  = [float(w*h) for (_, _, w, h) in bboxes]
    ids    = list(range(len(bboxes)))
    return {
        "id": ids,
        "bbox": bboxes,
        "category_id": list(map(int, labels)),
        "area": areas,
        "iscrowd": [0]*len(bboxes),
    }

train_dataset = train_dataset.with_transform(train_transform)
이미지 프로세서용 COCO 스타일 어노테이션을 만들어요.
import torch

def format_annotations(image, objects, image_id):
    n = len(objects["id"])
    anns = []
    iscrowd_list = objects.get("iscrowd", [0] * n)
    area_list = objects.get("area", None)

    for i in range(n):
        x, y, w, h = objects["bbox"][i]
        area = area_list[i] if area_list is not None else float(w * h)

        anns.append({
            "id": int(objects["id"][i]),
            "iscrowd": int(iscrowd_list[i]),
            "bbox": [float(x), float(y), float(w), float(h)],
            "category_id": int(objects.get("category_id", objects.get("category"))[i]),
            "area": float(area),
        })

    return {"image_id": int(image_id), "annotations": anns}
데이터 콜레이터에서 배치를 만들어요. 어노테이션을 형식화하고, 변환된 이미지와 함께 이미지 프로세서에 전달해요.
def collate_fn(examples):
    images = [example["image"] for example in examples]
    ann_batch = [format_annotations(example["image"], example["objects"], example["image_id"]) for example in examples]

    inputs = image_processor(images=images, annotations=ann_batch, return_tensors="pt")
    return inputs
Trainer를 초기화하고 모델 수렴을 위해 TrainingArguments를 설정해요. 데이터셋, 데이터 콜레이터, 인수, 모델을 Trainer에 전달해서 학습을 시작해요.
from transformers import Trainer, TrainingArguments

training_args = TrainingArguments(
    output_dir="./license-plate-detr-dinov3",
    per_device_train_batch_size=4,
    per_device_eval_batch_size=4,
    num_train_epochs=8,
    learning_rate=1e-5,
    weight_decay=1e-4,
    warmup_steps=500,
    eval_strategy="steps",
    eval_steps=500,
    save_total_limit=2,
    dataloader_pin_memory=False,
    fp16=True,
    report_to="trackio",
    load_best_model_at_end=True,
    remove_unused_columns=False,
    push_to_hub=True,
)

trainer = Trainer(
    model=model,
    args=training_args,
    train_dataset=train_dataset,
    eval_dataset=val_dataset,
    data_collator=collate_fn,
)

trainer.train()
Trainer와 이미지 프로세서를 Hub에 푸시해요.
trainer.push_to_hub()
image_processor.push_to_hub("merve/license-plate-detr-dinov3")
객체 탐지 파이프라인으로 모델을 테스트해요.
from transformers import pipeline

obj_detector = pipeline(
    "object-detection", model="merve/license-plate-detr-dinov3"
)
results = obj_detector("https://huggingface.co/datasets/merve/vlm_test_images/resolve/main/license-plates.jpg", threshold=0.05)
print(results)
결과를 시각화해요.
from PIL import Image, ImageDraw
import numpy as np
import requests

def plot_results(image, results, threshold):
    image = Image.fromarray(np.uint8(image))
    draw = ImageDraw.Draw(image)
    width, height = image.size

    for result in results:
        score = result["score"]
        label = result["label"]
        box = list(result["box"].values())

        if score > threshold:
            x1, y1, x2, y2 = tuple(box)
            draw.rectangle((x1, y1, x2, y2), outline="red")
            draw.text((x1 + 5, y1 + 10), f"{score:.2f}", fill="green" if score > 0.7 else "red")

    return image

image = Image.open(requests.get("https://huggingface.co/datasets/merve/vlm_test_images/resolve/main/license-plates.jpg", stream=True).raw)
plot_results(image, results, threshold=0.05)
