
Traefik 카나리아 배포
이 가이드에서는 Traefik과 Flagger를 사용해 카나리아 배포를 자동화하는 방법을 보여드립니다. Traefik의 TraefikService를 활용해 점진적으로 트래픽을 옮기고 검증하는 전체 과정을 살펴볼게요.
출처: 문서
본문
이 가이드에서는 Traefik과 Flagger를 사용해 카나리아 배포를 자동화하는 방법을 보여드립니다.
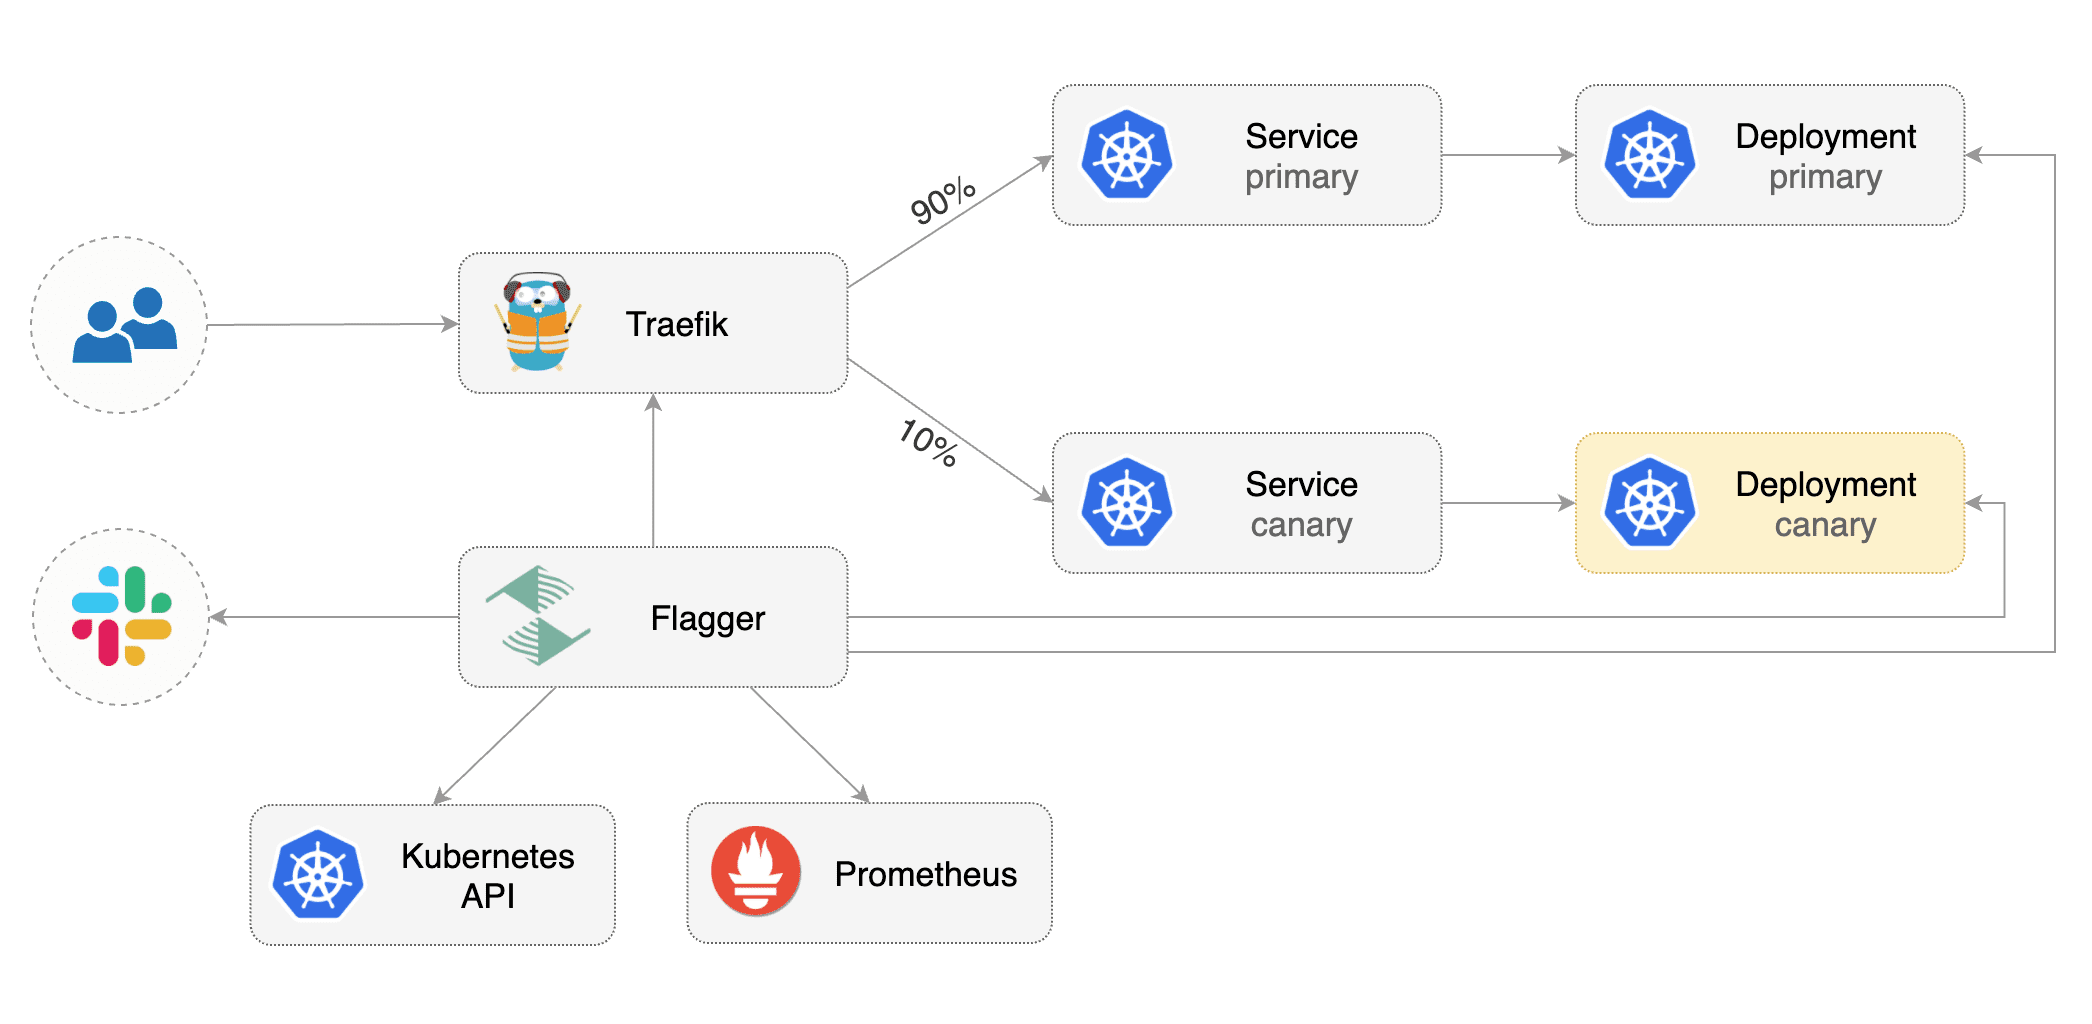
사전 요구사항 (Prerequisites)
Flagger는 Kubernetes 클러스터 v1.16 이상과 Traefik v2.3 이상이 필요합니다.
Helm v3로 Traefik을 설치합니다:
helm repo add traefik https://helm.traefik.io/traefik
kubectl create ns traefik

cat <<EOF | helm upgrade -i traefik traefik/traefik --namespace traefik -f -
deployment:
  podAnnotations:
    prometheus.io/port: "9100"
    prometheus.io/scrape: "true"
    prometheus.io/path: "/metrics"
metrics:
  prometheus:
    entryPoint: metrics
EOF
Traefik과 같은 네임스페이스에 Flagger와 Prometheus 애드온을 설치합니다:
helm repo add flagger https://flagger.app

helm upgrade -i flagger flagger/flagger \
--namespace traefik \
--set prometheus.install=true \
--set meshProvider=traefik
부트스트랩 (Bootstrap)
Flagger는 Kubernetes deployment와 선택적으로 horizontal pod autoscaler(HPA)를 받아, 일련의 오브젝트(Kubernetes deployments, ClusterIP services, TraefikService)를 생성합니다. 이 오브젝트들은 클러스터 외부에서 애플리케이션을 노출하고 카나리아 분석과 승격을 구동합니다.
테스트 네임스페이스를 만듭니다:
kubectl create ns test
deployment와 horizontal pod autoscaler를 만듭니다:
kubectl apply -k https://github.com/fluxcd/flagger//kustomize/podinfo?ref=main
카나리아 분석 중 트래픽을 생성할 부하 테스트 서비스를 배포합니다:
helm upgrade -i flagger-loadtester flagger/loadtester \
--namespace=test
Flagger가 생성한 TraefikService를 참조하는 Traefik IngressRoute를 만듭니다 (app.example.com을 자신의 도메인으로 바꾸세요):
apiVersion: traefik.io/v1alpha1
kind: IngressRoute
metadata:
  name: podinfo
  namespace: test
spec:
  entryPoints:
    - web
  routes:
    - match: Host(`app.example.com`)
      kind: Rule
      services:
        - name: podinfo
          kind: TraefikService
          port: 80
위 리소스를 podinfo-ingressroute.yaml로 저장한 뒤 적용합니다:
kubectl apply -f ./podinfo-ingressroute.yaml
canary 커스텀 리소스를 만듭니다 (app.example.com을 자신의 도메인으로 바꾸세요):
apiVersion: flagger.app/v1beta1
kind: Canary
metadata:
  name: podinfo
  namespace: test
spec:
  provider: traefik
  # deployment reference
  targetRef:
    apiVersion: apps/v1
    kind: Deployment
    name: podinfo
  # HPA reference (optional)
  autoscalerRef:
    apiVersion: autoscaling/v2
    kind: HorizontalPodAutoscaler
    name: podinfo
  # the maximum time in seconds for the canary deployment
  # to make progress before it is rollback (default 600s)
  progressDeadlineSeconds: 60
  service:
    # ClusterIP port number
    port: 80
    # container port number or name
    targetPort: 9898
  analysis:
    # schedule interval (default 60s)
    interval: 10s
    # max number of failed metric checks before rollback
    threshold: 10
    # max traffic percentage routed to canary
    # percentage (0-100)
    maxWeight: 50
    # canary increment step
    # percentage (0-100)
    stepWeight: 5
    # Traefik Prometheus checks
    metrics:
    - name: request-success-rate
      interval: 1m
      # minimum req success rate (non 5xx responses)
      # percentage (0-100)
      thresholdRange:
        min: 99
    - name: request-duration
      interval: 1m
      # maximum req duration P99
      # milliseconds
      thresholdRange:
        max: 500
    webhooks:
      - name: acceptance-test
        type: pre-rollout
        url: http://flagger-loadtester.test/
        timeout: 10s
        metadata:
          type: bash
          cmd: "curl -sd 'test' http://podinfo-canary.test/token | grep token"
      - name: load-test
        type: rollout
        url: http://flagger-loadtester.test/
        timeout: 5s
        metadata:
          type: cmd
          cmd: "hey -z 10m -q 10 -c 2 -host app.example.com http://traefik.traefik"
          logCmdOutput: "true"
위 리소스를 podinfo-canary.yaml로 저장한 뒤 적용합니다:
kubectl apply -f ./podinfo-canary.yaml
몇 초 후 Flagger가 canary 오브젝트를 생성합니다:
# applied
deployment.apps/podinfo
horizontalpodautoscaler.autoscaling/podinfo
canary.flagger.app/podinfo

# generated
deployment.apps/podinfo-primary
horizontalpodautoscaler.autoscaling/podinfo-primary
service/podinfo
service/podinfo-canary
service/podinfo-primary
traefikservice.traefik.io/podinfo
자동 카나리아 승격 (Automated canary promotion)
Flagger는 HTTP 요청 성공률, 요청 평균 지속 시간, 파드 상태 같은 핵심 성과 지표를 측정하면서 점진적으로 canary로 트래픽을 옮기는 제어 루프를 구현합니다. KPI 분석에 따라 canary는 승격되거나 중단되며, 분석 결과는 Slack 또는 MS Teams에 게시됩니다.

컨테이너 이미지를 업데이트해 카나리아 배포를 트리거합니다:
kubectl -n test set image deployment/podinfo \
podinfod=stefanprodan/podinfo:4.0.6
Flagger는 배포 리비전이 변경되었음을 감지하고 새 롤아웃을 시작합니다:
kubectl -n test describe canary/podinfo

Status:
  Canary Weight:         0
  Failed Checks:         0
  Phase:                 Succeeded
Events:
 New revision detected! Scaling up podinfo.test
 Waiting for podinfo.test rollout to finish: 0 of 1 updated replicas are available
 Pre-rollout check acceptance-test passed
 Advance podinfo.test canary weight 5
 Advance podinfo.test canary weight 10
 Advance podinfo.test canary weight 15
 Advance podinfo.test canary weight 20
 Advance podinfo.test canary weight 25
 Advance podinfo.test canary weight 30
 Advance podinfo.test canary weight 35
 Advance podinfo.test canary weight 40
 Advance podinfo.test canary weight 45
 Advance podinfo.test canary weight 50
 Copying podinfo.test template spec to podinfo-primary.test
 Waiting for podinfo-primary.test rollout to finish: 1 of 2 updated replicas are available
 Routing all traffic to primary
 Promotion completed! Scaling down podinfo.test
참고 카나리아 분석 중에 배포에 새 변경 사항을 적용하면 Flagger가 분석을 다시 시작합니다.
모든 canary는 다음과 같이 모니터링할 수 있습니다:
watch kubectl get canaries --all-namespaces

NAMESPACE   NAME        STATUS        WEIGHT   LASTTRANSITIONTIME
test        podinfo-2   Progressing   30       2020-08-14T12:32:12Z
test        podinfo     Succeeded     0        2020-08-14T11:23:88Z
자동 롤백 (Automated rollback)
카나리아 분석 중에 HTTP 500 오류를 생성해 Flagger가 결함 있는 버전을 일시 중지하고 롤백하는지 테스트할 수 있습니다.
또 다른 카나리아 배포를 트리거합니다:
kubectl -n test set image deployment/podinfo \
podinfod=stefanprodan/podinfo:4.0.6
로드 테스터 파드에 exec로 들어갑니다:
kubectl -n test exec -it deploy/flagger-loadtester bash
HTTP 500 오류를 생성합니다:
hey -z 1m -c 5 -q 5 http://app.example.com/status/500
지연 시간을 생성합니다:
watch -n 1 curl http://app.example.com/delay/1
실패한 검사 횟수가 카나리아 분석 임계값에 도달하면 트래픽은 primary로 다시 라우팅되고, canary는 0으로 스케일되며 롤아웃은 실패로 표시됩니다.
kubectl -n traefik logs deploy/flagger -f | jq .msg

New revision detected! Scaling up podinfo.test
Canary deployment podinfo.test not ready: waiting for rollout to finish: 0 of 1 updated replicas are available
Starting canary analysis for podinfo.test
Pre-rollout check acceptance-test passed
Advance podinfo.test canary weight 5
Advance podinfo.test canary weight 10
Advance podinfo.test canary weight 15
Advance podinfo.test canary weight 20
Halt podinfo.test advancement success rate 53.42% < 99%
Halt podinfo.test advancement success rate 53.19% < 99%
Halt podinfo.test advancement success rate 48.05% < 99%
Rolling back podinfo.test failed checks threshold reached 3
Canary failed! Scaling down podinfo.test
커스텀 메트릭 (Custom metrics)
카나리아 분석은 Prometheus 쿼리로 확장할 수 있습니다.
메트릭 템플릿을 만들고 클러스터에 적용합니다:
apiVersion: flagger.app/v1beta1
kind: MetricTemplate
metadata:
  name: not-found-percentage
  namespace: test
spec:
  provider:
    type: prometheus
    address: http://flagger-prometheus.traefik:9090
  query: |
    sum(
      rate(
        traefik_service_request_duration_seconds_bucket{
          service=~"{{ namespace }}-{{ target }}-canary-[0-9a-zA-Z-]+@kubernetescrd",
          code!="404",
        }[{{ interval }}]
      )
    )
    /
    sum(
      rate(
        traefik_service_request_duration_seconds_bucket{
          service=~"{{ namespace }}-{{ target }}-canary-[0-9a-zA-Z-]+@kubernetescrd",
        }[{{ interval }}]
      )
    ) * 100
카나리아 분석을 편집하고 not found 오류율 검사를 추가합니다:
  analysis:
    metrics:
      - name: "404s percentage"
        templateRef:
          name: not-found-percentage
        thresholdRange:
          max: 5
        interval: 1m
위 구성은 HTTP 404 req/sec 비율이 전체 트래픽의 5% 미만인지 확인해 canary를 검증합니다. 404 비율이 5% 임계값에 도달하면 canary는 실패합니다.
컨테이너 이미지를 업데이트해 카나리아 배포를 트리거합니다:
kubectl -n test set image deployment/podinfo \
podinfod=stefanprodan/podinfo:4.0.6
404를 생성합니다:
watch curl http://app.example.com/status/400
Flagger 로그를 봅니다:
kubectl -n traefik logs deployment/flagger -f | jq .msg

Starting canary deployment for podinfo.test
Advance podinfo.test canary weight 5
Advance podinfo.test canary weight 10
Advance podinfo.test canary weight 15
Halt podinfo.test advancement 404s percentage 6.20 > 5
Halt podinfo.test advancement 404s percentage 6.45 > 5
Halt podinfo.test advancement 404s percentage 7.60 > 5
Halt podinfo.test advancement 404s percentage 8.69 > 5
Halt podinfo.test advancement 404s percentage 9.70 > 5
Rolling back podinfo.test failed checks threshold reached 5
Canary failed! Scaling down podinfo.test
알림이 구성되어 있다면 Flagger는 canary가 실패한 이유와 함께 알림을 보냅니다.
분석 과정을 심층적으로 살펴보려면 사용 문서를 읽어보세요.