
제품 분류: 맞춤형 식품 분류를 위한 나만의 분류기 커스터마이징
제품 분류: 맞춤형 식품 분류를 위한 나만의 분류기 커스터마이징 (Product Classification: Customise your own classifier for tailored food categorization)
이 쿡북에서는 분류에 대해 깊이 다뤄볼 거예요. 특히 Classifier Factory를 활용해서 내 니즈와 사용 사례에 맞는 분류기를 만드는 방법에 집중해요. **멀티타겟 분류(multitarget classification)**를 다루는 특정 예제에 집중할게요.
출처: 문서
본문
이 쿡북에서는 분류를 깊이 다루면서, Classifier Factory를 활용해 당신의 니즈와 사용 사례에 맞는 분류기를 만드는 방법에 집중할 거예요.
단순하게 하기 위해, **멀티타겟 분류(multitarget classification)**를 요구하는 특정 예제에 집중할게요.
식품 분류 (Food Classification)
우리가 탐구할 특정 사용 사례는 식품 분류예요. 다양한 요리와 레시피를 여러 카테고리로 분류하고, 레시피의 주요 언어로 추가 분류하는 것을 목표로 해요.
우리는 세 가지 값에 집중할 거예요.
- 요리 또는 식품 이름 (The dish or food name)
- 속한 국가 (The country it belongs to)
- 다중 카테고리 (The multi-categories)
즉, 두 가지 주요 측면을 분류해야 해요: 국가와 식품이 속하는 카테고리.
또한 임의로, 카테고리가 없는 식품은 없어야 한다고 정할게요. 항상 최소 하나는 있어야 해요.
데이터셋 (Dataset)
이 목적을 위해, Open Food Facts 제품 데이터베이스의 하위 집합을 우리 사용 사례와 관련된 데이터로 사용할 거예요.
이 하위 집합은 가장 흔한 라벨에 집중하도록 큐레이션되었고, 균형을 맞추는 몇 가지 단계를 거쳤어요.
라벨 (Labels)
두 개의 주요 라벨이 있어요.
- 국가(Country), 단일 타겟(single target): 8가지 가능한 값 중 식품/요리의 해당 국가:
italy,spain,germany,france,united-states,belgium,united-kingdom,switzerland. - 카테고리(Category), 멀티 타겟(multi-target): 8가지 가능한 값 중 속하는 카테고리:
snacks,beverages,cereals-and-potatoes,plant-based-foods,dairies,plant-based-foods-and-beverages,meats-and-their-products,sweet-snacks.
8개 국가와 8개의 서로 다른 카테고리가 있어요.
각 라벨의 특성상 데이터셋은 다음과 같이 나뉘어요.
name: openfoodfacts/product-database 데이터셋의product_name에서 추출한 식품/요리 이름.country_label: openfoodfacts/product-database 데이터셋의countries_tags에서 추출한 국가 ID.category_labels: openfoodfacts/product-database 데이터셋의categories_tags에서 추출한 속하는 카테고리.
분포 (Distribution)

참고로, 샘플은 여러 카테고리를 가질 수 있으므로 식품 카테고리들은 서로 겹쳐요.
분할 (Splits)
데이터셋은 3개의 세트로 나뉘었어요.
train: 80%validation: 10%test: 10%
데이터 준비 (Data Preparation)
데이터셋을 다운로드해 볼게요. datasets를 설치하고 로드할 거예요.
%%capture
!pip install datasets
%%capture
from datasets import load_dataset

dataset = load_dataset('pandora-s/openfood-classification')
dataset
colab에서 판다스 데이터프레임으로 변환해서 테스트 세트를 직접 살펴볼 수 있어요.
Python
df = dataset["test"].to_pandas()
df
이제 데이터셋을 로드했으니, 학습을 위해 업로드할 올바른 원하는 형식으로 변환할 거예요.
데이터는 다음과 같은 jsonl 형식으로 변환돼요.
{"text": "Avena e nocciole cioccolato fondente", "labels": {"food": ["sweet-snacks"], "country_label": "italy"}}
{"text": "Pomodori in pezzi", "labels": {"food": ["plant-based-foods-and-beverages"], "country_label": "belgium"}}
{"text": "Grandyoats, Nori Sesame Cashews", "labels": {"food": ["snacks"], "country_label": "united-states"}}
{"text": "Jus d'orange Profit", "labels": {"food": ["beverages", "plant-based-foods-and-beverages"], "country_label": "switzerland"}}
{"text": "Rote Beete", "labels": {"food": ["plant-based-foods", "plant-based-foods-and-beverages"], "country_label": "germany"}}
...
라벨의 예는 다음과 같아요.
"labels": {
  "food": [
    "beverages",
    "plant-based-foods-and-beverages"
  ],
  "country_label": "switzerland"
}
멀티타겟 분류(multi-target classification)를 위한 것이에요.
Python
from tqdm import tqdm
import json

def dataset_to_jsonl(split):
    jsonl_data = []

    all_category_labels = set()
    all_countries = set()

    # Collect all unique category labels and countries
    for example in dataset[split]:
        all_category_labels.update(example['category_labels'].keys())
        all_countries.add(example['country_label'])

    # Convert sets to sorted lists for consistent formatting
    all_category_labels = sorted(all_category_labels)
    all_countries = sorted(all_countries)

    # Process each example in the split
    for example in tqdm(dataset[split]):
        labels = {
            "food": [
                tag
                for tag in all_category_labels
                if example['category_labels'][tag] == "true"
            ]
        }
        labels["country_label"] = example['country_label']

        jsonl_data.append({
            "text": example['name'],
            "labels": labels
        })

    return jsonl_data, all_category_labels, all_countries

# Process each split
train_jsonl, _, _ = dataset_to_jsonl('train')
validation_jsonl, _, _ = dataset_to_jsonl('validation')
test_jsonl, all_category_labels, all_country_labels = dataset_to_jsonl('test')

# Save the formatted data as JSONL files
for split, data in zip(['train', 'validation', 'test'], [train_jsonl, validation_jsonl, test_jsonl]):
    with open(f'{split}_openfood_classification.jsonl', 'w') as f:
        for entry in data:
            f.write(json.dumps(entry) + '\n')

print("JSONL files have been saved.")
데이터가 올바르게 변환·저장됐어요. 이제 모델을 학습시킬 수 있어요.
학습 (Training)
모델을 학습시키는 방법은 두 가지예요. la platforme에서 업로드·학습하거나, API를 통해 학습할 수 있어요.
먼저 mistralai를 설치할게요.
Python
!pip install mistralai
from mistralai.client import Mistral

# Set the API key for Mistral
api_key = "API_KEY"

# Set your Weights and Biases key
wandb_key = "WANDB_KEY"

# Initialize the Mistral client
client = Mistral(api_key=api_key)
학습 세트와 검증 세트(선택)의 2개 파일을 업로드할게요. 검증 세트는 검증 손실(validation loss)에 사용됩니다.
# Upload the training data
training_data = client.files.upload(
    file={
        "file_name": "train_openfood_classification.jsonl",
        "content": open("train_openfood_classification.jsonl", "rb"),
    }
)

# Upload the validation data
validation_data = client.files.upload(
    file={
        "file_name": "validation_openfood_classification.jsonl",
        "content": open("validation_openfood_classification.jsonl", "rb"),
    }
)
데이터가 업로드됐으니 작업(job)을 만들 수 있어요.
우리는 사용자들이 상당히 많은 지표를 추적할 수 있도록 Weights and Biases 통합을 지원하는데, 이 기능을 적극 권장해요. 프로젝트 이름과 키를 제공하면 사용할 수 있어요.
Python
# Create a fine-tuning job
created_job = client.fine_tuning.jobs.create(
    model="ministral-3b-latest",
    job_type="classifier",
    training_files=[{"file_id": training_data.id, "weight": 1}],
    validation_files=[validation_data.id],
    hyperparameters={"training_steps": 250, "learning_rate": 0.00007},
    auto_start=False,
    integrations=[
        {
            "project": "product-classifier",
            "api_key": wandb_key,
        }
    ]
)
print(json.dumps(created_job.model_dump(), indent=4))
작업이 생성되면 epoch 수와 같은 세부사항을 검토할 수 있어요. 덕분에 작업을 시작하기 전에 정보를 바탕으로 결정을 내릴 수 있어요.
작업을 가져와서 시작 전에 검증 프로세스가 완료될 때까지 기다릴게요. 이 검증 단계는 작업이 시작할 준비가 되었는지 보장해요.
Python
# Retrieve the job details
retrieved_job = client.fine_tuning.jobs.get(job_id=created_job.id)
print(json.dumps(retrieved_job.model_dump(), indent=4))

import time
from IPython.display import clear_output

# Wait for the job to be validated
while retrieved_job.status not in ["VALIDATED"]:
    retrieved_job = client.fine_tuning.jobs.get(job_id=created_job.id)

    clear_output(wait=True)  # Clear the previous output (User Friendly)
    print(json.dumps(retrieved_job.model_dump(), indent=4))
    time.sleep(1)
이제 작업을 실행할 수 있어요.
Python
# Start the fine-tuning job
client.fine_tuning.jobs.start(job_id=created_job.id)

# Retrieve the job details again
retrieved_job = client.fine_tuning.jobs.get(job_id=created_job.id)
print(json.dumps(retrieved_job.model_dump(), indent=4))
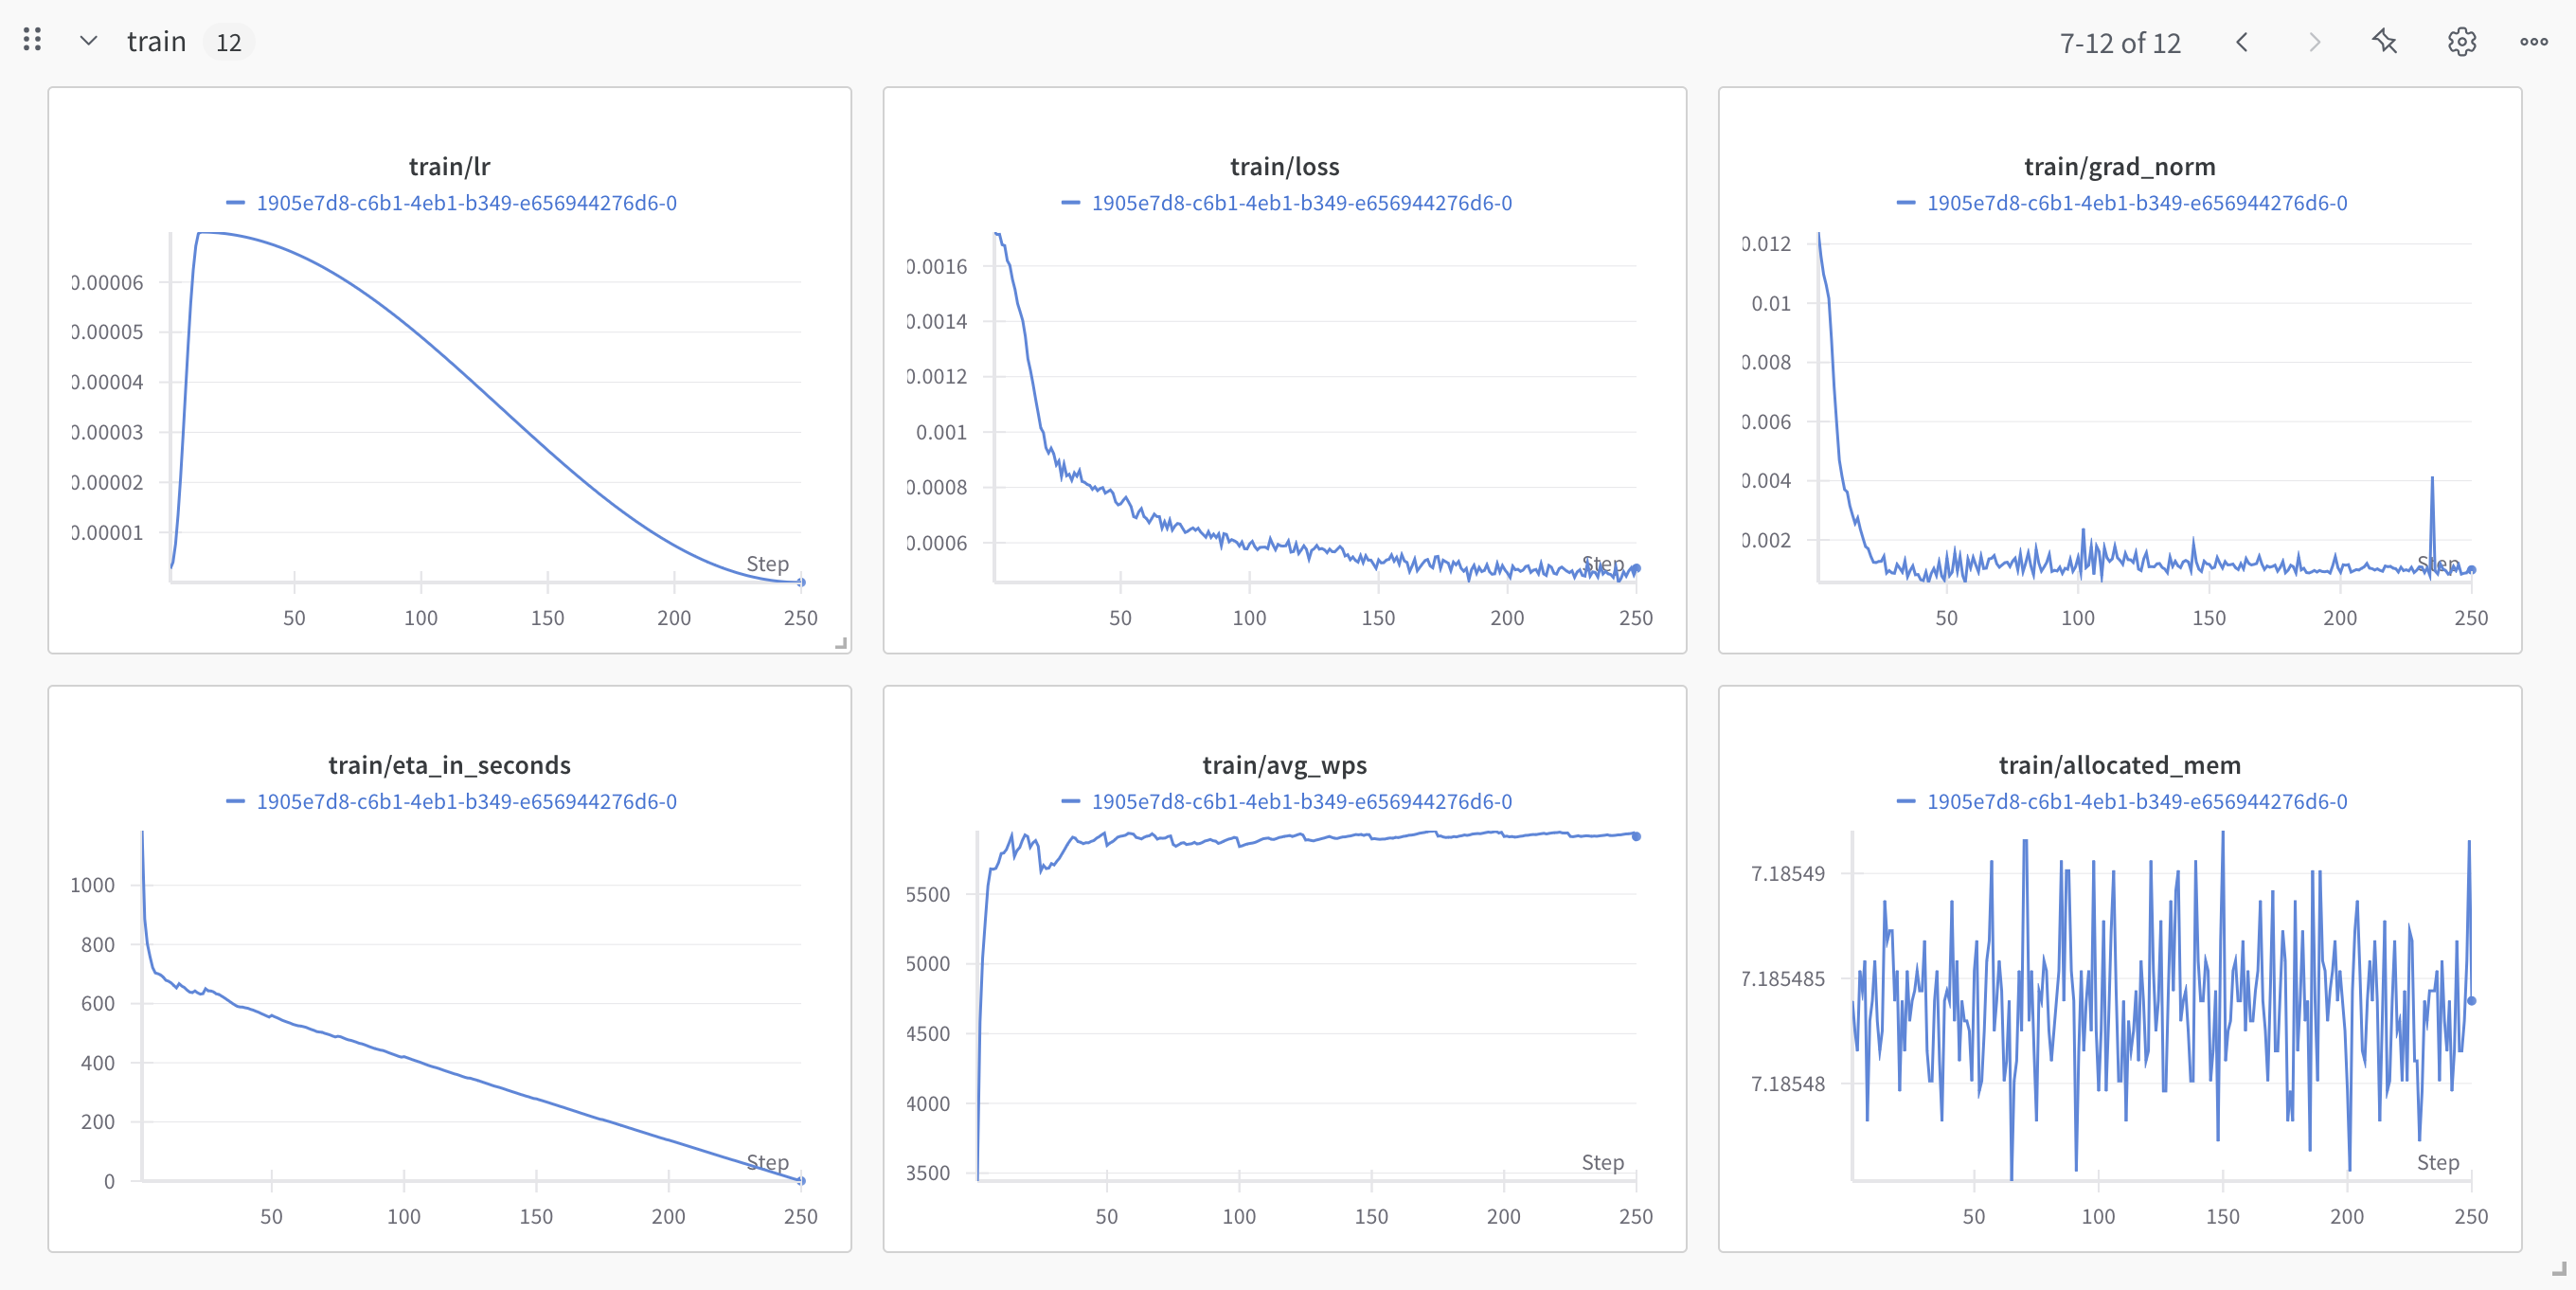
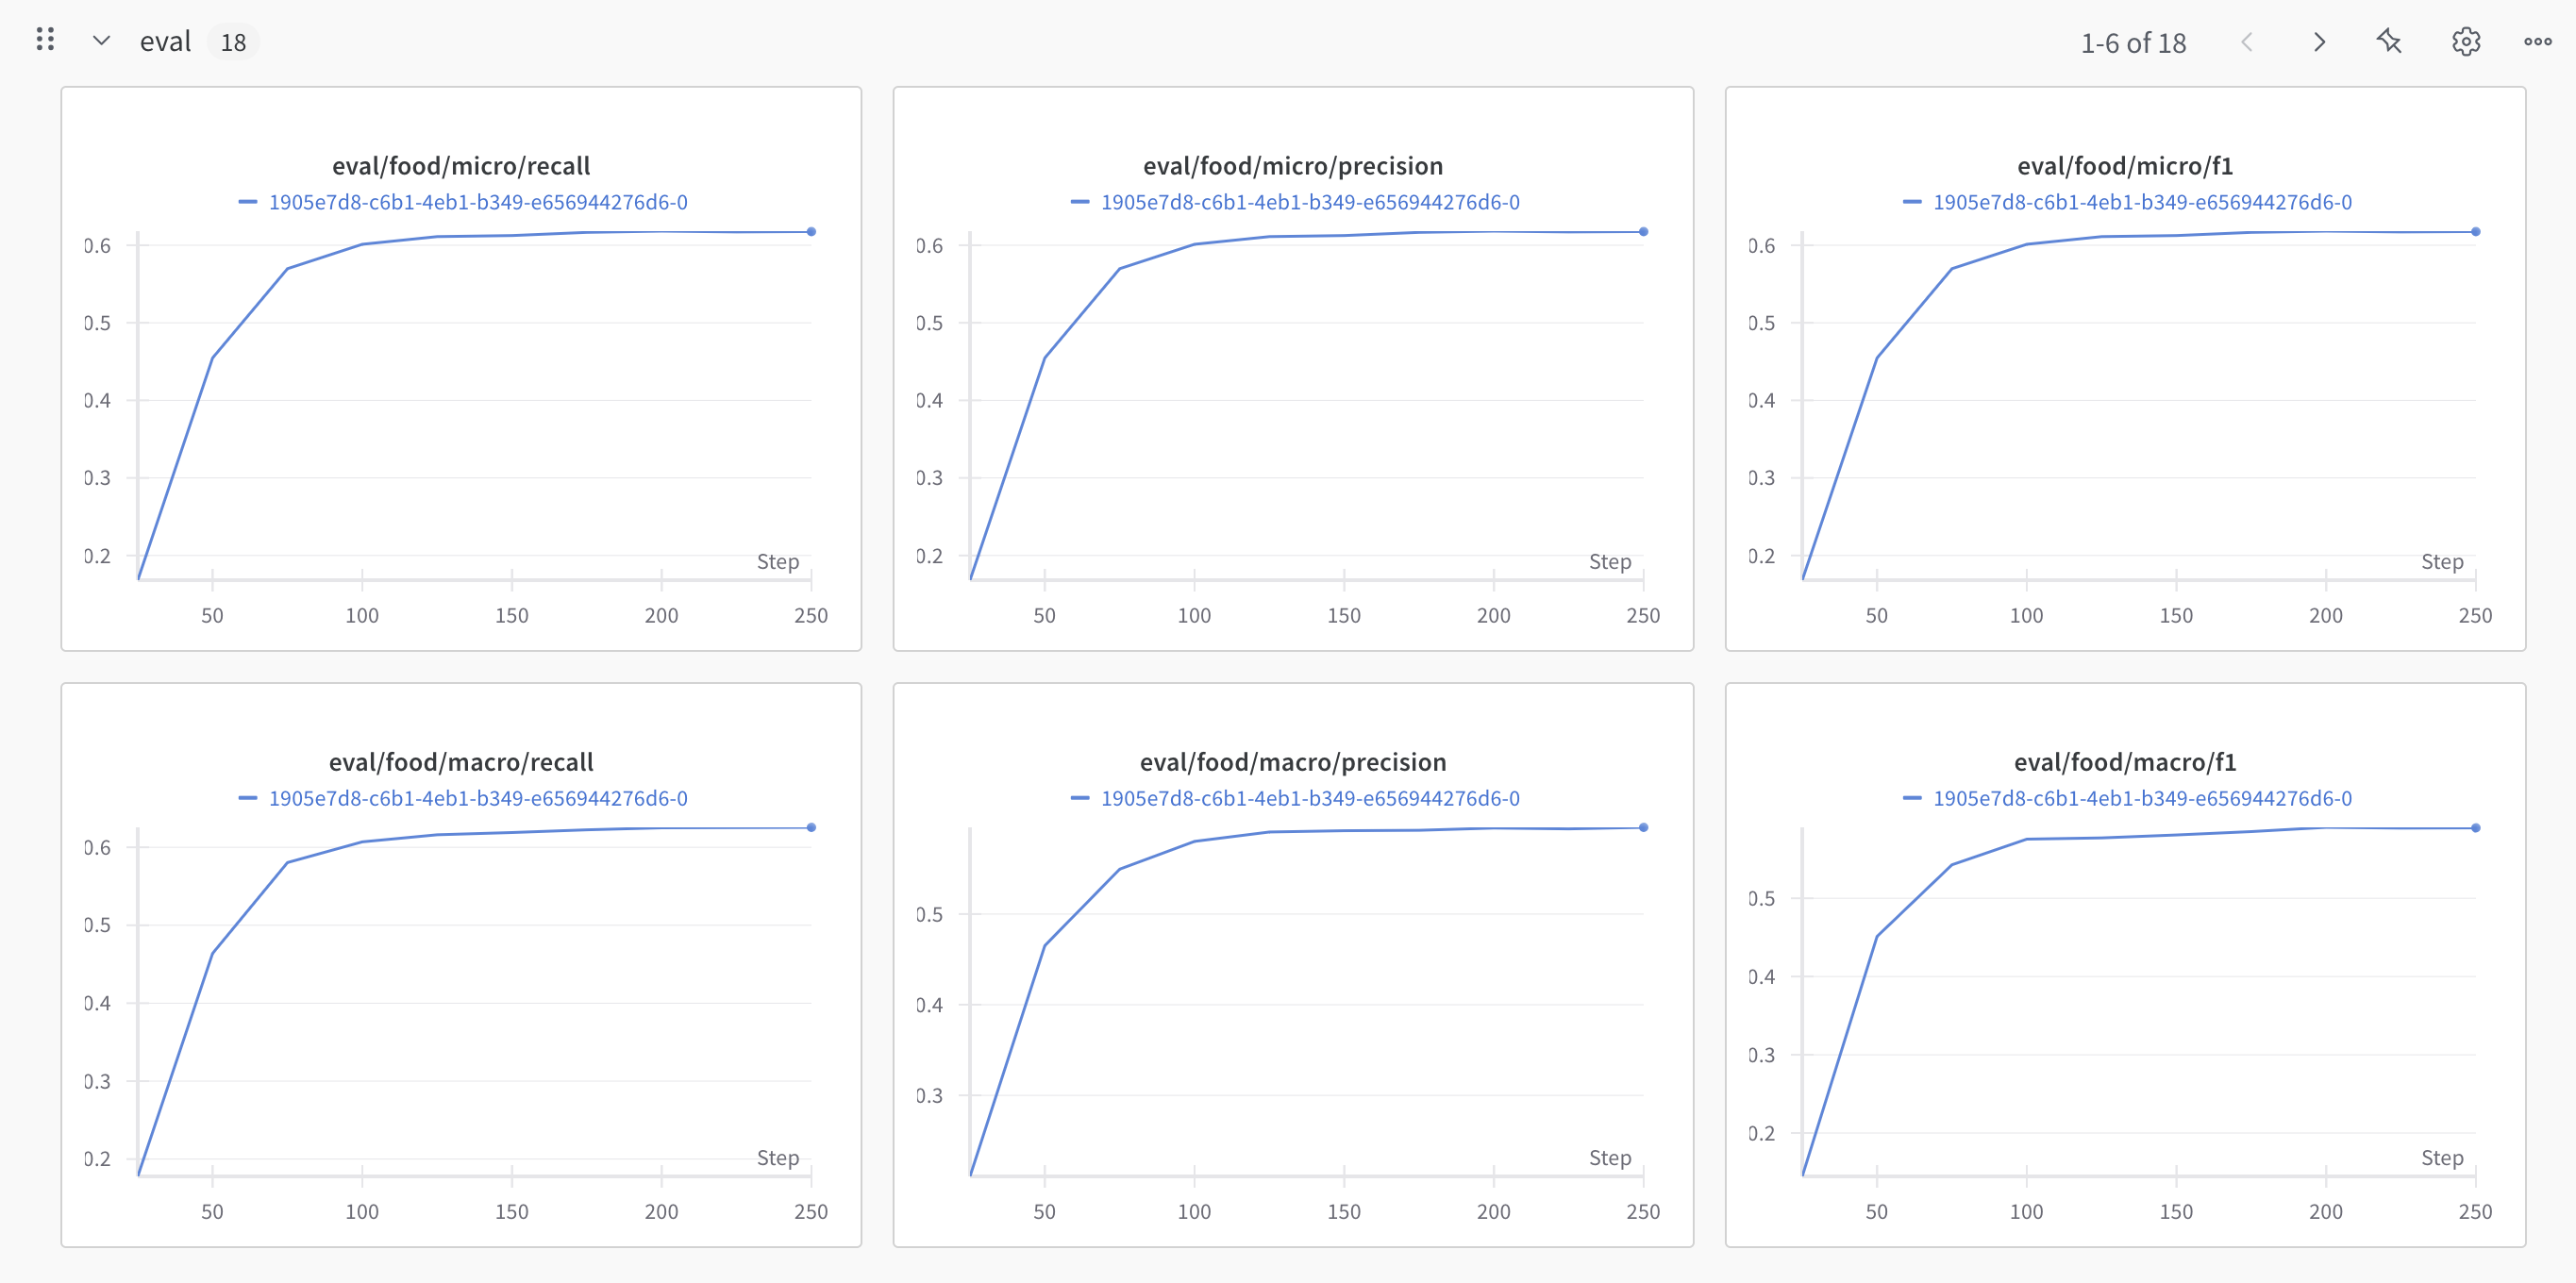
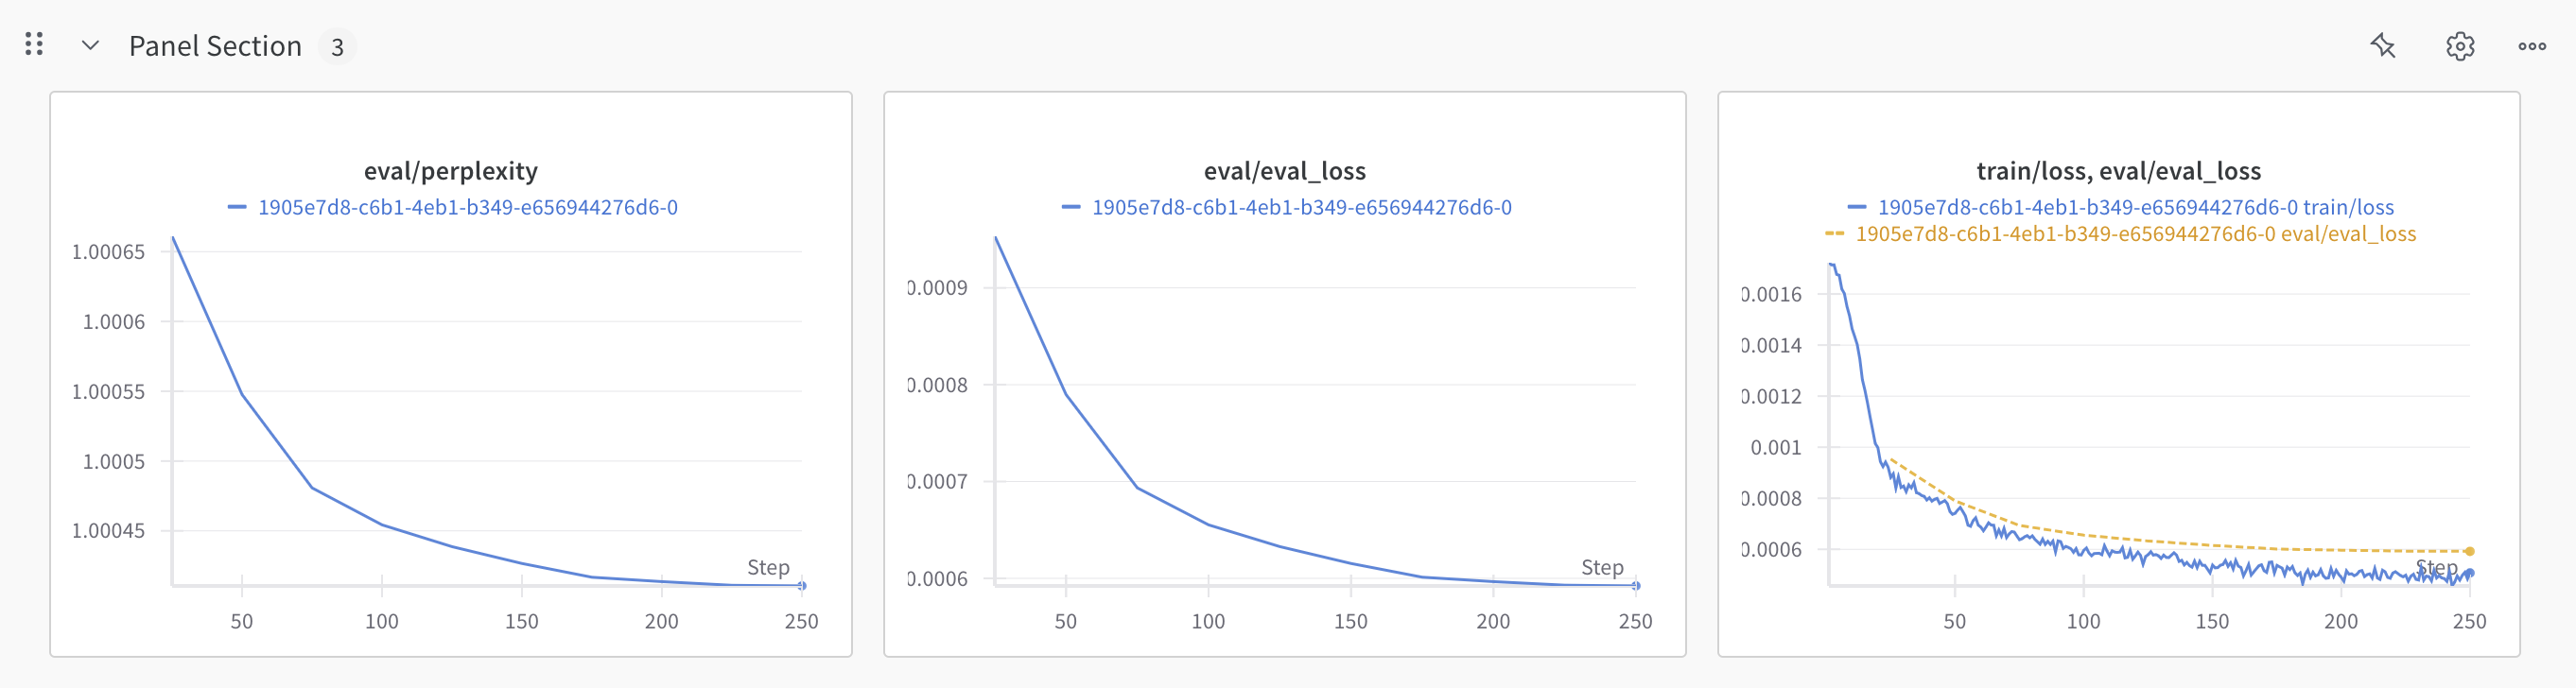
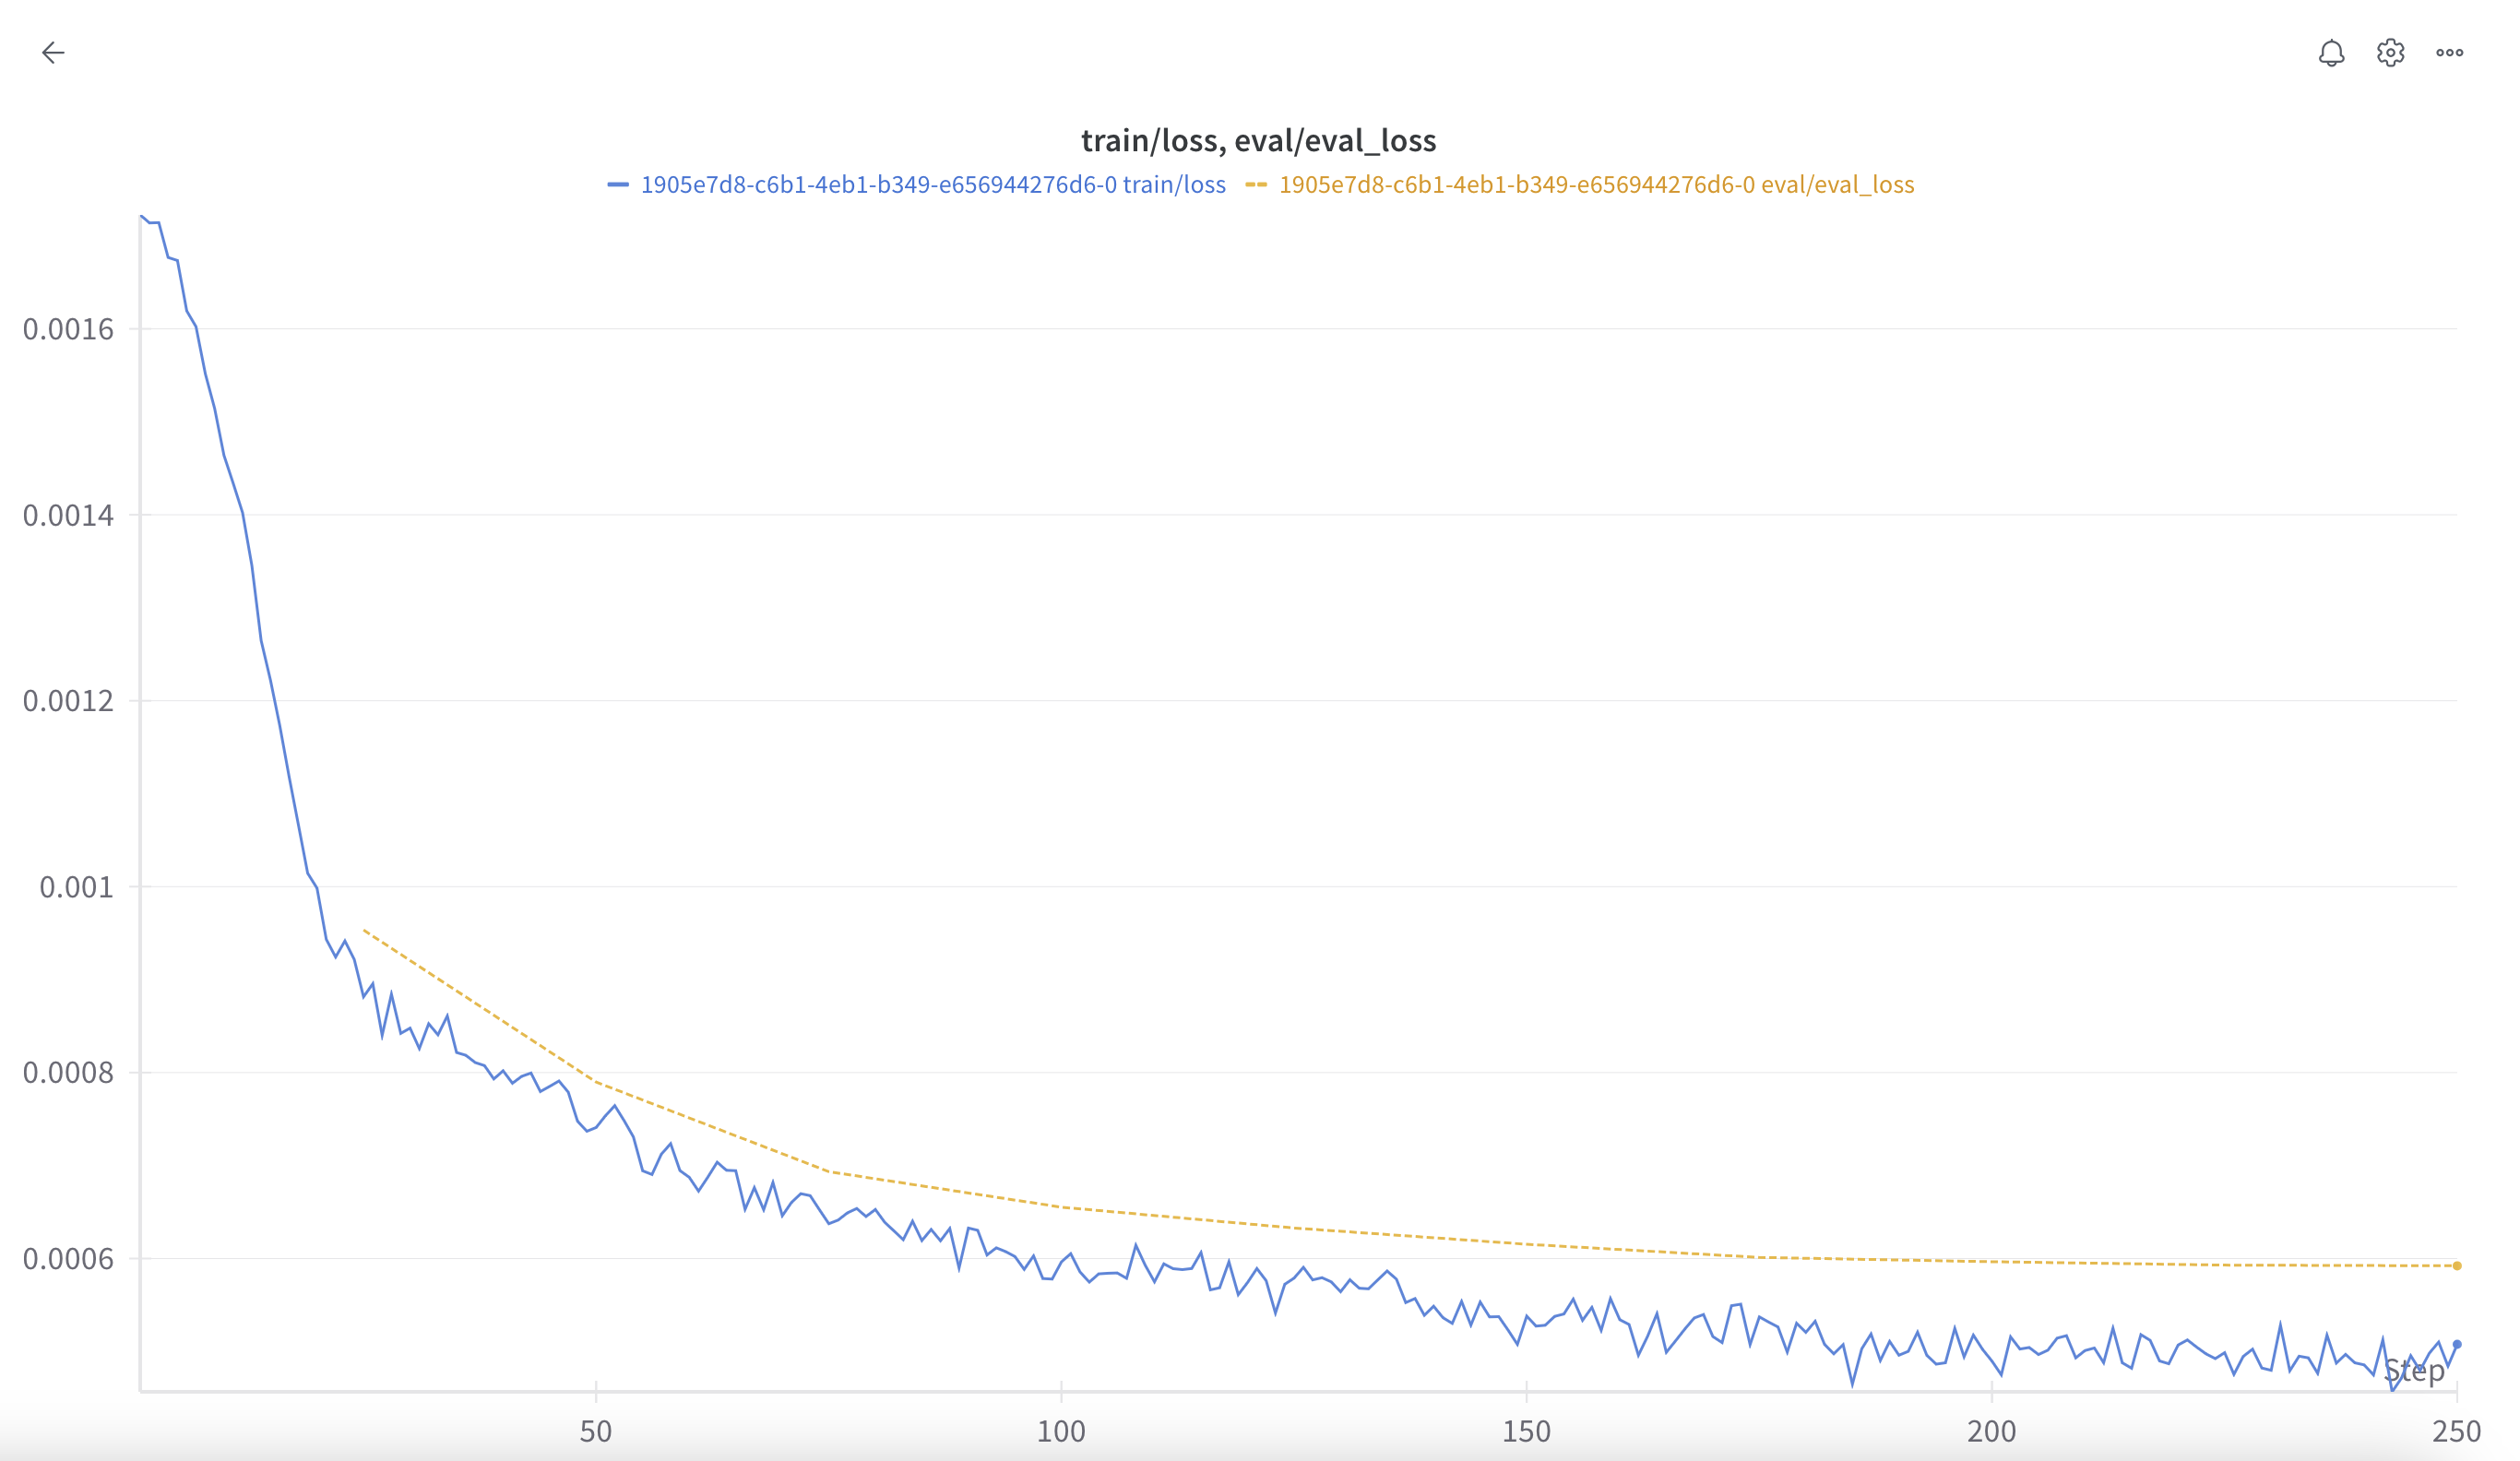
작업이 이제 시작되고 있어요. 상태를 추적하면서 손실을 그래프로 그려 볼게요.
이를 위해 Weights and Biases 통합 사용을 강력히 권장하지만, 이 노트북에서 직접 추적할 수도 있어요.
WANDB
학습 (Training):
평가/검증 (Eval/Validation):
더 보기 (More):
Python
# @title Loss Plot
import pandas as pd
import time
import matplotlib.pyplot as plt
from IPython.display import clear_output

# Initialize DataFrames to store the metrics
train_metrics_df = pd.DataFrame(columns=["Step Number", "Train Loss"])
valid_metrics_df = pd.DataFrame(columns=["Step Number", "Valid Loss"])

# Total training steps
total_training_steps = retrieved_job.hyperparameters.training_steps

# Wait for the job to complete
while retrieved_job.status in ["QUEUED", "RUNNING"]:
    retrieved_job = client.fine_tuning.jobs.get(job_id=created_job.id)

    if retrieved_job.status == "QUEUED":
        time.sleep(5)
        continue

    # Clear the previous output (User Friendly)
    clear_output(wait=True)
    print(retrieved_job.status)

    # Extract metrics from all checkpoints
    for checkpoint in retrieved_job.checkpoints[::-1]:
        metrics = checkpoint.metrics
        step_number = checkpoint.step_number

        # Check if the step number is already in the DataFrame
        if (
            step_number
            not in train_metrics_df["Step Number"]
        ):
            # Prepare the new row for train loss
            train_row = {
                "Step Number": step_number,
                "Train Loss": metrics.train_loss,
            }

            # Append the new train metrics to the DataFrame
            train_metrics_df = pd.concat(
                [train_metrics_df, pd.DataFrame([train_row])], ignore_index=True
            )

            # Prepare the new row for valid loss if available
            if metrics.valid_loss != 0:
                valid_row = {
                    "Step Number": step_number,
                    "Valid Loss": metrics.valid_loss,
                }
                # Append the new valid metrics to the DataFrame
                valid_metrics_df = pd.concat(
                    [valid_metrics_df, pd.DataFrame([valid_row])], ignore_index=True
                )

    if len(retrieved_job.checkpoints) > 0:
        # Sort the DataFrames by step number
        train_metrics_df = train_metrics_df.sort_values(by="Step Number")
        valid_metrics_df = valid_metrics_df.sort_values(by="Step Number")

        # Plot the evolution of train loss and valid loss
        plt.figure(figsize=(10, 6))

        # Plot train loss
        plt.plot(
            train_metrics_df["Step Number"],
            train_metrics_df["Train Loss"],
            label="Train Loss",
            linestyle="-",
        )

        # Highlight start and end points of train loss
        plt.scatter(
            train_metrics_df.iloc[[0, -1]]["Step Number"],
            train_metrics_df.iloc[[0, -1]]["Train Loss"],
            color="blue",
            zorder=5,
        )

        # Plot valid loss only if available
        if not valid_metrics_df.empty:
            plt.plot(
                valid_metrics_df["Step Number"],
                valid_metrics_df["Valid Loss"],
                label="Valid Loss",
                linestyle="--",
            )

            # Highlight start and end points of valid loss
            plt.scatter(
                valid_metrics_df.iloc[[0, -1]]["Step Number"],
                valid_metrics_df.iloc[[0, -1]]["Valid Loss"],
                color="orange",
                zorder=5,
            )

        plt.xlabel("Step Number")
        plt.ylabel("Loss")
        plt.title("Train Loss and Valid Loss")
        plt.legend()
        plt.grid(True)
        plt.show()

    time.sleep(1)
추론 (Inference)
모델이 학습되어 사용할 준비가 됐어요! 테스트 세트의 샘플로 테스트해 볼게요.
Python
# Load the test samples
with open("test_openfood_classification.jsonl", "r") as f:
    test_samples = [json.loads(l) for l in f.readlines()]

# Classify the first test sample
classifier_response = client.classifiers.classify(
    model=retrieved_job.fine_tuned_model,
    inputs=[test_samples[0]["text"]],
)
print("Text:", test_samples[0]["text"])
print("Classifier Response:", json.dumps(classifier_response.model_dump(), indent=4))
한 걸음 더 나아가, LLM을 사용한 일반적인 프롬프팅 기법과 우리의 새 분류기를 나란히 비교할 수도 있어요. 이를 위해 구조화된 출력으로 여러 LLM에 테스트 세트를 실행하고, 결과를 우리 분류기와 비교할 거예요.
# @title Load Test and Set Response Type
import json
from pydantic import BaseModel
from enum import Enum
from typing import List

# Load the JSONL file
file_path = 'test_openfood_classification.jsonl'
test_dataset = []

with open(file_path, 'r') as file:
    for line in file:
        test_dataset.append(json.loads(line))

# Define the enumerators for categories and countries
Category = Enum('Category', {category.replace('-', '_'): category for category in all_category_labels})
Country = Enum('Country', {country.replace('-', '_'): country for country in all_country_labels})

# Define the Food model using the enumerators
class Food(BaseModel):
    categories: List[Category]
    country: Country
# @title Define the Classify Function
import random

instruction_prompt = """Classify the following food product, you need to classify the country of the dish and the food categories it belongs to.

Product Name: {}"""

def classify(text: str, model: str) -> tuple:
    try:
        if model["type"] == "random":
            possible_categories = list(all_category_labels)
            possible_countries = list(all_country_labels)
            predicted_categories = random.sample(possible_categories, random.randint(0, len(possible_categories)))
            predicted_country = random.choice(possible_countries)
            return predicted_categories, predicted_country
        elif model["type"] == "classifier":
            classifier_response = client.classifiers.classify(
                model=model["model_id"],
                inputs=[text],
            )
            results = classifier_response.results[0]

            # Extract all labels with their scores
            labels_with_scores = {label: results['food'].scores[label] for label in results['food'].scores.keys()}

            # Find the country with the highest score
            country_scores = results['country_label'].scores
            country_with_highest_score = max(country_scores, key=country_scores.get)

            return labels_with_scores, country_with_highest_score
        else:
            chat_response = client.chat.parse(
                model=model["model_id"],
                messages=[
                    {
                        "role": "user",
                        "content": instruction_prompt.format(text),
                    },
                ],
                response_format=Food,
                max_tokens=512,
                temperature=0
            )

            return [c.value for c in chat_response.choices[0].message.parsed.categories], chat_response.choices[0].message.parsed.country.value
    except Exception as e:
        return {}, None
Python
# @title Run Evaluation
from tqdm import tqdm
import numpy as np

# Number of samples to evaluate
n_samples = 300

def calculate_score(actual, predicted):
    """
    Calculate the accuracy score for a single label.

    Parameters:
    - actual: List of actual labels for each entry.
    - predicted: List of predicted labels for each entry.

    Returns:
    - The accuracy score as a float.
    """
    correct_predictions_count = 0
    total_predictions_count = 0

    for actual_labels, predicted_labels in zip(actual, predicted):
        if actual_labels or predicted_labels:
            total_predictions_count += 1
            if actual_labels and predicted_labels:
                correct_predictions_count += 1

    return correct_predictions_count / total_predictions_count if total_predictions_count > 0 else 0

def calculate_country_score(actual, predicted):
    """
    Calculate the accuracy score for country predictions.

    Parameters:
    - actual: List of actual country labels for each entry.
    - predicted: List of predicted country labels for each entry.

    Returns:
    - The accuracy score as a float.
    """
    correct_predictions_count = sum(actual_country == predicted_country for actual_country, predicted_country in zip(actual, predicted))
    total_predictions = len(actual)
    accuracy_score = correct_predictions_count / total_predictions if total_predictions > 0 else 0

    return accuracy_score

def evaluate_classifier(dataset, model):
    """
    Evaluate the classifier model on the dataset.

    Parameters:
    - dataset: List of entries with text and labels.
    - model: Dictionary containing model details.

    Returns:
    - Category scores, country score, average category score, and best threshold (if applicable).
    """

    # Initialize dictionaries to store actual and predicted labels for each category
    category_scores = {label: {"actual": [], "predicted": []} for label in all_category_labels}
    all_actual_countries = []
    all_predicted_countries = []

    # Store raw scores for classifier models
    raw_scores = []

    # Evaluate each entry in the dataset
    for entry in tqdm(dataset[:n_samples]):
        text = entry["text"]
        actual_categories = [cat for cat in entry["labels"]["food"]]
        actual_country = entry["labels"]["country_label"]

        # Predict categories and country using the model
        if model["type"] == "classifier":
            predicted_categories, predicted_country = classify(text, model)
            raw_scores.append((predicted_categories, predicted_country))
        else:
            predicted_categories, predicted_country = classify(text, model)

        # Accumulate actual and predicted categories and countries
        all_actual_countries.append(actual_country)
        all_predicted_countries.append(predicted_country)

        for label in all_category_labels:
            actual_label = [label] if label in actual_categories else []
            predicted_label = [label] if label in predicted_categories else []
            category_scores[label]["actual"].append(actual_label)
            category_scores[label]["predicted"].append(predicted_label)

    if model["type"] == "classifier":
        best_threshold = None
        best_average_category_score = 0

        # Find the best threshold for the classifier model
        for threshold in model["thresholds"]:
            actual_labels_per_category = {label: data["actual"] for label, data in category_scores.items()}
            predicted_labels_per_category = {label: [] for label in all_category_labels}

            for raw_score in raw_scores:
                predicted_categories, _ = raw_score
                predicted_labels = [label for label, score in predicted_categories.items() if score > threshold]
                for label in all_category_labels:
                    predicted_labels_per_category[label].append([label] if label in predicted_labels else [])

            category_score_results = {
                label: calculate_score(actual_labels_per_category[label], predicted_labels_per_category[label])
                for label in all_category_labels
            }
            average_category_score = np.mean(list(category_score_results.values()))

            if average_category_score > best_average_category_score:
                best_average_category_score = average_category_score
                best_threshold = threshold

        # Use the best threshold to compute final scores
        predicted_labels_per_category = {label: [] for label in all_category_labels}

        for raw_score in raw_scores:
            predicted_categories, _ = raw_score
            predicted_labels = [label for label, score in predicted_categories.items() if score > best_threshold]
            for label in all_category_labels:
                predicted_labels_per_category[label].append([label] if label in predicted_labels else [])

        category_score_results = {
            label: calculate_score(actual_labels_per_category[label], predicted_labels_per_category[label])
            for label in all_category_labels
        }
        country_score = calculate_country_score(all_actual_countries, all_predicted_countries)
        average_category_score = best_average_category_score
        return category_score_results, country_score, average_category_score, best_threshold
    else:
        # Prepare the actual and predicted labels for each category
        actual_labels_per_category = {label: data["actual"] for label, data in category_scores.items()}
        predicted_labels_per_category = {label: data["predicted"] for label, data in category_scores.items()}

        # Calculate score for each category and overall country score
        category_score_results = {
            label: calculate_score(actual_labels_per_category[label], predicted_labels_per_category[label])
            for label in all_category_labels
        }
        country_score = calculate_country_score(all_actual_countries, all_predicted_countries)

        # Calculate average category score
        average_category_score = np.mean(list(category_score_results.values()))

        return category_score_results, country_score, average_category_score, None

# Dictionary to store model evaluation results
model_results = {}

# List of models to evaluate
models = [
    {"type": "random", "model_name": "Random"},
    {
        "type": "classifier",
        "model_name": "Finetuned Classifier 3B",
        "model_id": retrieved_job.fine_tuned_model,
        "thresholds": [0.05, 0.1, 0.15, 0.2, 0.25, 0.3, 0.35, 0.4, 0.45, 0.5, 0.6, 0.7, 0.8, 0.9] # the thresholds to try our multilabels on, depending on your data, training and use case, you may want to change your threshold to get the best score out of your model for your specific metric
    },
    {"type": "instruction", "model_name": "Ministral 3B", "model_id": "ministral-3b-latest"},
    {"type": "instruction", "model_name": "Ministral 8B", "model_id": "ministral-8b-latest"},
    {"type": "instruction", "model_name": "Mistral Small 24B", "model_id": "mistral-small-latest"},
    {"type": "instruction", "model_name": "Mistral Large 123B", "model_id": "mistral-large-latest"},
]

# Evaluate each model
for model in models:
    print("\nRunning", model, "...")
    category_scores, country_score, average_category_score, best_threshold = evaluate_classifier(test_dataset, model)

    result = {
        "category_scores": category_scores,
        "average_category_score": average_category_score,
        "country_score": country_score,
    }

    model_name = model['model_name']
    if model["type"] == "classifier":
        model_name = f"{model['model_name']} Threshold: {best_threshold}"

    model_results[model_name] = result

    print(f"Category Scores: {category_scores}")
    print(f"Average Category Score: {average_category_score}")
    print(f"Country Score: {country_score}")
    if model["type"] == "classifier":
        print(f"Best Threshold: {best_threshold}")
Python
# @title Plot Results
import numpy as np
import matplotlib.pyplot as plt
from matplotlib import cm

def plot_bar_chart(ax, data, labels, title, xlabel, ylabel, colors, bar_width, best_model=None):
    index = np.arange(len(labels))
    total_bars = len(labels) * len(data)

    group_spacing = 0.4
    group_width = bar_width * len(data)

    # Get the scores for the "random" model
    random_scores = data.get('Random', [0] * len(labels))

    # Get the scores for the best model
    best_model_scores = data.get(best_model, [0] * len(labels)) if best_model else [0] * len(labels)

    for i, (model, metrics) in enumerate(data.items()):
        positions = index + i * bar_width - group_width / 2 + group_spacing / 2
        color = 'red' if model == 'Random' else colors[i]
        bars = ax.bar(positions, metrics, width=bar_width, label=model, color=color, zorder=2)

        # Check if the model is the best model
        if model == best_model:
            for bar in bars:
                bar.set_hatch('//')
                bar.set_edgecolor('#FF8C00')
                height = bar.get_height()
                ax.annotate(f'{int(100 * height)}%',
                            xy=(bar.get_x() + bar.get_width() / 2, height),
                            xytext=(0, 5),
                            textcoords="offset points",
                            ha='center', va='bottom',
                            color='orange', fontsize=10)

        # Annotate the random model's bars
        if model == 'Random':
            for bar in bars:
                height = bar.get_height()
                ax.annotate(f'{int(100 * height)}%',
                            xy=(bar.get_x() + bar.get_width() / 2, height),
                            xytext=(0, 5),  # 5 points vertical offset
                            textcoords="offset points",
                            ha='center', va='bottom',
                            color='red', fontsize=10)

    # Add a red horizontal line for the "random" model's scores
    for idx, score in enumerate(random_scores):
        ax.hlines(y=score, xmin=index[idx] - group_width / 2 + bar_width,
                  xmax=index[idx] + group_width / 2 + bar_width, color='red', linestyle=':', linewidth=0.8, zorder=3)

    # Add a green horizontal line for the "best" model's scores
    for idx, score in enumerate(best_model_scores):
        ax.hlines(y=score, xmin=index[idx] - group_width / 2 + bar_width,
                  xmax=index[idx] + group_width / 2 + bar_width, color='orange', linestyle=':', linewidth=0.8, zorder=3)

    ax.set_title(title)
    ax.set_xlabel(xlabel)
    ax.set_ylabel(ylabel)
    ax.set_xticks(index + group_spacing / 2)
    ax.set_xticklabels(labels, rotation=0, ha='center', fontsize=6)
    ax.set_ylim(0, 1.19)
    ax.legend(title='Model', bbox_to_anchor=(1.05, 1), loc='upper left')

    # Add a light grid in the background
    ax.grid(True, linestyle='--', linewidth=0.5, alpha=0.7, zorder=1)

def plot_score_metrics(model_results, n_samples):
    # Find best model
    best_model = max(
        (model for model in model_results.keys()),
        key=lambda model: model_results[model]['average_category_score'],
        default=None
    )

    models = [m for m in model_results.keys()]
    colors = cm.YlOrBr(np.linspace(0.4, 0.6, len(models)))

    # Create a figure with a 2x1 grid of subplots
    fig, axes = plt.subplots(nrows=2, ncols=1, figsize=(24, 16))
    fig.suptitle(f'Scores (n_samples = {n_samples})')

    # Categories Score
    categories_score = {model: [model_results[model]['category_scores'][category] for category in model_results[model]['category_scores']] for model in models}
    plot_bar_chart(axes[0], categories_score, list(model_results[models[0]]['category_scores'].keys()),
                   'Category Scores', 'Category', 'Score', colors, 0.14, best_model)

    # Average Category Score and Countries Score as subplots in the second row
    average_category_score = {model: [model_results[model]['average_category_score']] for model in models}
    countries_score = {model: [model_results[model]['country_score']] for model in models}

    # Combine the two metrics into one subplot
    combined_metrics = {model: average_category_score[model] + countries_score[model] for model in models}
    plot_bar_chart(axes[1], combined_metrics, ['Average Category Scores', 'Country Scores'],
                   'Average Category and Country Scores', 'Metric', 'Score', colors, 0.14, best_model)

    plt.show()

plot_score_metrics(model_results, n_samples)
이 특정 사용 사례에서 대부분의 LLM은 어려움을 겪어요. 이는 나쁜 프롬프팅, 작은 모델, 너무 특수한 사용 사례 등 다양한 이유 때문일 수 있어요.
하지만 우리의 파인튜닝된 분류기는 매우 뛰어난 성능을 보여서, 다른 모든 모델을 상당한 격차로 능가해요! 덕분에 더 나을 뿐만 아니라, 훨씬 작은 모델이라 더 효율적이고 저렴하기도 해요.