
데이터 분석 에이전트 만들기
데이터 분석 에이전트 만들기 (Build a data analysis agent)
데이터 파일을 분석하고, 시각화를 생성하고, 결과를 공유하는 에이전트를 만들어 보세요.
개요 (Overview)
이 가이드는 deep agent를 사용해 데이터 분석 에이전트를 만드는 방법을 보여줍니다. 데이터 분석 작업은 보통 다단계 추론, 코드 실행, 그리고 스크립트·보고서·플롯 같은 산출물 작업이 필요합니다. 이는 deep agent가 처리하도록 설계된 기능입니다.
만들 에이전트는 다음과 같이 동작합니다:
- 분석할 CSV 파일을 받습니다.
- 옵트인 todo 목록으로 분석 단계를 계획하고 추적합니다.
- 탐색적 데이터 분석을 수행하고 시각화를 생성합니다.
- 결과를 Slack 채널에 공유합니다.
핵심 개념 (Key concepts)
이 튜토리얼이 다루는 내용:
- 샌드박스 코드 실행을 위한 Backends
- 외부 통합을 위한 커스텀 도구
TodoListMiddleware를 통한 옵트인 작업 계획
설정 (Setup)
설치 (Installation)
핵심 의존성을 설치하세요:
선택 의존성 (Optional dependencies)
이 튜토리얼에서는 다음을 사용합니다:
- 결과 공유를 위한 Slack Python SDK (토큰 설정)
- 코드 실행을 위한 LangSmith 샌드박스
LangSmith
LangChain으로 만드는 많은 애플리케이션은 LLM 호출을 여러 번 수행하는 여러 단계로 구성됩니다. 애플리케이션이 복잡해질수록 체인이나 에이전트 안에서 정확히 무엇이 일어나는지 검사할 수 있는 것이 중요해집니다. 이를 위한 가장 좋은 방법은 LangSmith를 사용하는 것입니다.
위 링크에서 가입한 뒤, 추적 로깅을 시작하도록 환경 변수를 설정하세요:
export LANGSMITH_TRACING="true"
export LANGSMITH_API_KEY="..."
백엔드 설정 (Set up the backend)
Deep Agents는 샌드박스 환경에서 코드를 실행하기 위해 백엔드를 사용합니다.
아래 예시들은 LangSmith 샌드박스를 사용합니다. 다른 프로바이더는 사용 가능한 프로바이더를 참조하세요.
  ```bash uv theme={"theme":{"light":"catppuccin-latte","dark":"catppuccin-mocha"}}
  uv add "langsmith[sandbox]"
  ```
</CodeGroup>

```python theme={"theme":{"light":"catppuccin-latte","dark":"catppuccin-mocha"}}
from deepagents.backends.langsmith import LangSmithSandbox
from langsmith.sandbox import SandboxClient

client = SandboxClient()
ls_sandbox = client.create_sandbox()
backend = LangSmithSandbox(sandbox=ls_sandbox)
```
```python theme={"theme":{"light":"catppuccin-latte","dark":"catppuccin-mocha"}}
from deepagents.backends import LocalShellBackend

backend = LocalShellBackend(
    root_dir=".",
    virtual_mode=True,
    env={"PATH": "/usr/bin:/bin"},
)
```
  ```bash uv theme={"theme":{"light":"catppuccin-latte","dark":"catppuccin-mocha"}}
  uv add langchain-agentcore-codeinterpreter
  ```
</CodeGroup>

```python theme={"theme":{"light":"catppuccin-latte","dark":"catppuccin-mocha"}}
from bedrock_agentcore.tools.code_interpreter_client import CodeInterpreter
from langchain_agentcore_codeinterpreter import AgentCoreSandbox

interpreter = CodeInterpreter(region="us-west-2")
interpreter.start()
backend = AgentCoreSandbox(interpreter=interpreter)
```
  ```bash uv theme={"theme":{"light":"catppuccin-latte","dark":"catppuccin-mocha"}}
  uv add langchain-daytona
  ```
</CodeGroup>

```python theme={"theme":{"light":"catppuccin-latte","dark":"catppuccin-mocha"}}
from daytona import Daytona

from langchain_daytona import DaytonaSandbox

sandbox = Daytona().create()
backend = DaytonaSandbox(sandbox=sandbox)
```

샌드박스가 준비됐는지 확인하세요:

```python theme={"theme":{"light":"catppuccin-latte","dark":"catppuccin-mocha"}}
result = backend.execute("echo ready")
print(result)
# ExecuteResponse(output='ready', exit_code=0, ...)
```
  ```bash uv theme={"theme":{"light":"catppuccin-latte","dark":"catppuccin-mocha"}}
  uv add langchain-e2b
  ```
</CodeGroup>

```python theme={"theme":{"light":"catppuccin-latte","dark":"catppuccin-mocha"}}
from e2b import Sandbox
from langchain_e2b import E2BSandbox

e2b_sandbox = Sandbox.create()
backend = E2BSandbox(sandbox=e2b_sandbox)
```
from langchain_modal import ModalSandbox

app = modal.App.lookup("your-app")
modal_sandbox = modal.Sandbox.create(app=app)
backend = ModalSandbox(sandbox=modal_sandbox)
```
  ```bash uv theme={"theme":{"light":"catppuccin-latte","dark":"catppuccin-mocha"}}
  uv add langchain-runloop
  ```
</CodeGroup>

```python theme={"theme":{"light":"catppuccin-latte","dark":"catppuccin-mocha"}}
from runloop_api_client import RunloopSDK

from langchain_runloop import RunloopSandbox

api_key = "..."
client = RunloopSDK(bearer_token=api_key)

devbox = client.devbox.create()
backend = RunloopSandbox(devbox=devbox)
```
샘플 데이터 업로드 (Upload sample data)
샘플 판매 데이터를 만들고 백엔드에 업로드하세요:
import csv
import io

# Create sample sales data
data = [
    ["Date", "Product", "Units Sold", "Revenue"],
    ["2025-08-01", "Widget A", 10, 250],
    ["2025-08-02", "Widget B", 5, 125],
    ["2025-08-03", "Widget A", 7, 175],
    ["2025-08-04", "Widget C", 3, 90],
    ["2025-08-05", "Widget B", 8, 200],
]

# Convert to CSV bytes
text_buf = io.StringIO()
writer = csv.writer(text_buf)
writer.writerows(data)
csv_bytes = text_buf.getvalue().encode("utf-8")
text_buf.close()

# Upload to backend
backend.upload_files([("/root/data/sales_data.csv", csv_bytes)])
커스텀 도구 구현 (Implement custom tools)
데이터 분석 작업은 보고서나 플롯 같은 산출물을 만들 수 있습니다.
다음의 간단한 도구는 backend.download_files로 그것들을 다운로드한 뒤 Slack SDK로 업로드합니다.
또한 에이전트에게 업로드 대신 관련 파일 경로를 나열하라고 할 수도 있는데, 그러면 관심 있는 사람이 필요할 때 별도로 가져갈 수 있습니다.
import os

from langchain.tools import tool
from slack_sdk import WebClient

slack_token = os.environ["SLACK_USER_TOKEN"]
slack_client = WebClient(token=slack_token)
channel = "C0123456ABC"  # specify your own channel here


@tool(parse_docstring=True)
def slack_send_message(text: str, file_path: str | None = None) -> str:
    """Send message, optionally including attachments such as images.

    Args:
        text: (str) text content of the message
        file_path: (str) file path of attachment in the filesystem.
    """
    if not file_path:
        slack_client.chat_postMessage(channel=channel, text=text)
    else:
        fp = backend.download_files([file_path])
        slack_client.files_upload_v2(
            channel=channel,
            content=fp[0].content,
            initial_comment=text,
        )

    return "Message sent."
작업 계획 활성화 (Enable task planning)
작업 계획은 옵트인입니다. 데이터 분석은 종종 길고 다단계 작업을 수반하므로, 에이전트를 만들 때 TodoListMiddleware를 전달하세요. 그러면 에이전트는 탐색적 분석, 시각화, 공유 단계를 추적하기 위한 write_todos 도구를 얻습니다.
다음 섹션의 create_deep_agent 호출에 이 미들웨어를 포함하세요.
에이전트 실행 (Run the agent)
에이전트를 인스턴스화해 봅시다:
from langchain_core.utils.uuid import uuid7

from deepagents import create_deep_agent
from langchain.agents.middleware import TodoListMiddleware
from langgraph.checkpoint.memory import InMemorySaver

checkpointer = InMemorySaver()

agent = create_deep_agent(
    model="google_genai:gemini-3.6-flash",
    tools=[slack_send_message],
    backend=backend,
    checkpointer=checkpointer,
    middleware=[TodoListMiddleware()],
)

thread_id = str(uuid7())
config = {"configurable": {"thread_id": thread_id}}
우리는 다음을 포함합니다:
이제 에이전트를 호출해 봅시다.
input_message = {
    "role": "user",
    "content": (
        "Analyze ./data/sales_data.csv in the current dir and generate a beautiful plot. "
        "When finished, send your analysis and the plot to Slack using the tool."
    ),
}
stream = agent.stream_events(
    {"messages": [input_message]},
    config,
    version="v3",
)
for snapshot in stream.values:
    snapshot["messages"][-1].pretty_print()
================================== Ai Message ==================================

[{'text': "I'll help you analyze the sales data and create a beautiful plot, then send the results to Slack. Let me start by exploring the data.", 'type': 'text'}, {'id': 'toolu_01LRot5h6WkhdpDQ1SG6EQGQ', 'input': {'file_path': './data/sales_data.csv'}, 'name': 'read_file', 'type': 'tool_use'}]
Tool Calls:
  read_file (toolu_01LRot5h6WkhdpDQ1SG6EQGQ)
 Call ID: toolu_01LRot5h6WkhdpDQ1SG6EQGQ
  Args:
    file_path: ./data/sales_data.csv
================================= Tool Message =================================
Name: read_file

Error: File '/data/sales_data.csv' not found
================================== Ai Message ==================================

[{'text': 'Let me check the current directory structure first:', 'type': 'text'}, {'id': 'toolu_018DSeF8Dx714Dh2M5vJ1JuK', 'input': {'command': 'pwd'}, 'name': 'execute', 'type': 'tool_use'}, {'id': 'toolu_01As782aRsVB3mJpKPKNwg9c', 'input': {'path': '/'}, 'name': 'ls', 'type': 'tool_use'}]
Tool Calls:
  execute (toolu_018DSeF8Dx714Dh2M5vJ1JuK)
 Call ID: toolu_018DSeF8Dx714Dh2M5vJ1JuK
  Args:
    command: pwd
  ls (toolu_01As782aRsVB3mJpKPKNwg9c)
 Call ID: toolu_01As782aRsVB3mJpKPKNwg9c
  Args:
    path: /
================================= Tool Message =================================
Name: execute

/root
[Command succeeded with exit code 0]
================================= Tool Message =================================
Name: ls

['/bin', '/boot', '/dev', '/etc', '/home', '/lib', '/lib64', '/media', '/mnt', '/opt', '/proc', '/root', '/run', '/sbin', '/srv', '/sys', '/tmp', '/usr', '/var', '/.dockerenv']
================================== Ai Message ==================================

[{'id': 'toolu_01Sv4ut1P2XFsjrzVmQbJLpr', 'input': {'path': '/root'}, 'name': 'ls', 'type': 'tool_use'}]
Tool Calls:
  ls (toolu_01Sv4ut1P2XFsjrzVmQbJLpr)
 Call ID: toolu_01Sv4ut1P2XFsjrzVmQbJLpr
  Args:
    path: /root
================================= Tool Message =================================
Name: ls

['/root/.bash_logout', '/root/.bashrc', '/root/.profile', '/root/data']
================================== Ai Message ==================================

[{'text': "Great! I can see there's a data directory. Let me check its contents:", 'type': 'text'}, {'id': 'toolu_01WN6V9RZjGGoDXzuWdEgB1z', 'input': {'path': '/root/data'}, 'name': 'ls', 'type': 'tool_use'}]
Tool Calls:
  ls (toolu_01WN6V9RZjGGoDXzuWdEgB1z)
 Call ID: toolu_01WN6V9RZjGGoDXzuWdEgB1z
  Args:
    path: /root/data
================================= Tool Message =================================
Name: ls

['/root/data/sales_data.csv']
================================== Ai Message ==================================

[{'text': 'Perfect! Now let me read the sales data:', 'type': 'text'}, {'id': 'toolu_01RFmneg7mua1G5csH3rH2Zq', 'input': {'file_path': '/root/data/sales_data.csv'}, 'name': 'read_file', 'type': 'tool_use'}]
Tool Calls:
  read_file (toolu_01RFmneg7mua1G5csH3rH2Zq)
 Call ID: toolu_01RFmneg7mua1G5csH3rH2Zq
  Args:
    file_path: /root/data/sales_data.csv
================================= Tool Message =================================
Name: read_file

     1	Date,Product,Units Sold,Revenue
     2	2025-08-01,Widget A,10,250
     3	2025-08-02,Widget B,5,125
     4	2025-08-03,Widget A,7,175
     5	2025-08-04,Widget C,3,90
     6	2025-08-05,Widget B,8,200
================================== Ai Message ==================================

[{'text': "Excellent! I can see the sales data. Now I'll create a Python script to analyze the data and generate a beautiful plot. Let me create a comprehensive analysis with visualizations:", 'type': 'text'}, {'id': 'toolu_01JcBjEXgPpCPuaGxn9ALwMg', 'input': {'file_path': '/root/analyze_sales.py', 'content': 'import pandas as pd\nimport matplotlib.pyplot as plt\nimport seaborn as sns\nfrom datetime import datetime\n\n# Set style for beautiful plots\nsns.set_style("whitegrid")\nplt.rcParams[\'figure.figsize\'] = (14, 10)\nplt.rcParams[\'font.size\'] = 11\n\n# Read the data\ndf = pd.read_csv(\'/root/data/sales_data.csv\')\ndf[\'Date\'] = pd.to_datetime(df[\'Date\'])\n\n# Analysis\nprint("=" * 60)\nprint("SALES DATA ANALYSIS REPORT")\nprint("=" * 60)\nprint("\\n1. DATA OVERVIEW")\nprint("-" * 60)\nprint(f"Date Range: {df[\'Date\'].min().strftime(\'%Y-%m-%d\')} to {df[\'Date\'].max().strftime(\'%Y-%m-%d\')}")\nprint(f"Total Records: {len(df)}")\nprint(f"Products: {\', \'.join(df[\'Product\'].unique())}")\n\nprint("\\n2. SUMMARY STATISTICS")\nprint("-" * 60)\nprint(f"Total Revenue: ${df[\'Revenue\'].sum():,.2f}")\nprint(f"Total Units Sold: {df[\'Units Sold\'].sum()}")\nprint(f"Average Daily Revenue: ${df[\'Revenue\'].mean():.2f}")\nprint(f"Average Units per Sale: {df[\'Units Sold\'].mean():.2f}")\n\nprint("\\n3. PRODUCT PERFORMANCE")\nprint("-" * 60)\nproduct_stats = df.groupby(\'Product\').agg({\n    \'Revenue\': [\'sum\', \'mean\'],\n    \'Units Sold\': [\'sum\', \'mean\']\n}).round(2)\nprint(product_stats)\n\nprint("\\n4. BEST PERFORMING DAY")\nprint("-" * 60)\nbest_day = df.loc[df[\'Revenue\'].idxmax()]\nprint(f"Date: {best_day[\'Date\'].strftime(\'%Y-%m-%d\')}")\nprint(f"Product: {best_day[\'Product\']}")\nprint(f"Revenue: ${best_day[\'Revenue\']:.2f}")\nprint(f"Units Sold: {best_day[\'Units Sold\']}")\n\n# Create visualizations\nfig = plt.figure(figsize=(16, 12))\nfig.suptitle(\'Sales Data Analysis Dashboard\', fontsize=20, fontweight=\'bold\', y=0.995)\n\n# 1. Re... [truncated]
Tool Calls:
  write_file (toolu_01JcBjEXgPpCPuaGxn9ALwMg)
 Call ID: toolu_01JcBjEXgPpCPuaGxn9ALwMg
  Args:
    file_path: /root/analyze_sales.py
    content: import pandas as pd
import matplotlib.pyplot as plt
import seaborn as sns
from datetime import datetime

# Set style for beautiful plots
sns.set_style("whitegrid")
plt.rcParams['figure.figsize'] = (14, 10)
plt.rcParams['font.size'] = 11

# Read the data
df = pd.read_csv('/root/data/sales_data.csv')
df['Date'] = pd.to_datetime(df['Date'])

# Analysis
print("=" * 60)
print("SALES DATA ANALYSIS REPORT")
print("=" * 60)
print("\n1. DATA OVERVIEW")
print("-" * 60)
print(f"Date Range: {df['Date'].min().strftime('%Y-%m-%d')} to {df['Date'].max().strftime('%Y-%m-%d')}")
print(f"Total Records: {len(df)}")
print(f"Products: {', '.join(df['Product'].unique())}")

print("\n2. SUMMARY STATISTICS")
print("-" * 60)
print(f"Total Revenue: ${df['Revenue'].sum():,.2f}")
print(f"Total Units Sold: {df['Units Sold'].sum()}")
print(f"Average Daily Revenue: ${df['Revenue'].mean():.2f}")
print(f"Average Units per Sale: {df['Units Sold'].mean():.2f}")

print("\n3. PRODUCT PERFORMANCE")
print("-" * 60)
product_stats = df.groupby('Product').agg({
    'Revenue': ['sum', 'mean'],
    'Units Sold': ['sum', 'mean']
}).round(2)
print(product_stats)

print("\n4. BEST PERFORMING DAY")
print("-" * 60)
best_day = df.loc[df['Revenue'].idxmax()]
print(f"Date: {best_day['Date'].strftime('%Y-%m-%d')}")
print(f"Product: {best_day['Product']}")
print(f"Revenue: ${best_day['Revenue']:.2f}")
print(f"Units Sold: {best_day['Units Sold']}")

# Create visualizations
fig = plt.figure(figsize=(16, 12))
fig.suptitle('Sales Data Analysis Dashboard', fontsize=20, fontweight='bold', y=0.995)

# 1. Revenue by Date
ax1 = plt.subplot(2, 3, 1)
colors = sns.color_palette("husl", len(df))
bars = ax1.bar(df['Date'].dt.strftime('%m-%d'), df['Revenue'], color=colors, edgecolor='black', linewidth=1.5)
ax1.set_title('Daily Revenue', fontsize=14, fontweight='bold', pad=10)
ax1.set_xlabel('Date', fontsize=12, fontweight='bold')
ax1.set_ylabel('Revenue ($)', fontsize=12, fontweight='bold')
ax1.grid(axis='y', alpha=0.3)
for bar in bars:
    height = bar.get_height()
    ax1.text(bar.get_x() + bar.get_width()/2., height,
            f'${int(height)}',
            ha='center', va='bottom', fontsize=9, fontweight='bold')
plt.setp(ax1.xaxis.get_majorticklabels(), rotation=45)

# 2. Units Sold by Date
ax2 = plt.subplot(2, 3, 2)
bars = ax2.bar(df['Date'].dt.strftime('%m-%d'), df['Units Sold'], color=colors, edgecolor='black', linewidth=1.5)
ax2.set_title('Daily Units Sold', fontsize=14, fontweight='bold', pad=10)
ax2.set_xlabel('Date', fontsize=12, fontweight='bold')
ax2.set_ylabel('Units', fontsize=12, fontweight='bold')
ax2.grid(axis='y', alpha=0.3)
for bar in bars:
    height = bar.get_height()
    ax2.text(bar.get_x() + bar.get_width()/2., height,
            f'{int(height)}',
            ha='center', va='bottom', fontsize=9, fontweight='bold')
plt.setp(ax2.xaxis.get_majorticklabels(), rotation=45)

# 3. Revenue by Product (Pie Chart)
ax3 = plt.subplot(2, 3, 3)
product_revenue = df.groupby('Product')['Revenue'].sum()
colors_pie = sns.color_palette("Set2", len(product_revenue))
wedges, texts, autotexts = ax3.pie(product_revenue, labels=product_revenue.index, autopct='%1.1f%%',
                                     colors=colors_pie, startangle=90, textprops={'fontsize': 11, 'fontweight': 'bold'},
                                     explode=[0.05] * len(product_revenue))
ax3.set_title('Revenue Distribution by Product', fontsize=14, fontweight='bold', pad=10)
for autotext in autotexts:
    autotext.set_color('white')
    autotext.set_fontsize(12)

# 4. Total Revenue by Product (Bar Chart)
ax4 = plt.subplot(2, 3, 4)
product_revenue_sorted = product_revenue.sort_values(ascending=False)
colors_product = sns.color_palette("coolwarm", len(product_revenue_sorted))
bars = ax4.barh(product_revenue_sorted.index, product_revenue_sorted.values, color=colors_product, edgecolor='black', linewidth=1.5)
ax4.set_title('Total Revenue by Product', fontsize=14, fontweight='bold', pad=10)
ax4.set_xlabel('Revenue ($)', fontsize=12, fontweight='bold')
ax4.set_ylabel('Product', fontsize=12, fontweight='bold')
ax4.grid(axis='x', alpha=0.3)
for i, (product, revenue) in enumerate(product_revenue_sorted.items()):
    ax4.text(revenue, i, f' ${int(revenue)}', va='center', fontsize=10, fontweight='bold')

# 5. Total Units Sold by Product
ax5 = plt.subplot(2, 3, 5)
product_units = df.groupby('Product')['Units Sold'].sum().sort_values(ascending=False)
colors_units = sns.color_palette("viridis", len(product_units))
bars = ax5.barh(product_units.index, product_units.values, color=colors_units, edgecolor='black', linewidth=1.5)
ax5.set_title('Total Units Sold by Product', fontsize=14, fontweight='bold', pad=10)
ax5.set_xlabel('Units', fontsize=12, fontweight='bold')
ax5.set_ylabel('Product', fontsize=12, fontweight='bold')
ax5.grid(axis='x', alpha=0.3)
for i, (product, units) in enumerate(product_units.items()):
    ax5.text(units, i, f' {int(units)}', va='center', fontsize=10, fontweight='bold')

# 6. Product Distribution
ax6 = plt.subplot(2, 3, 6)
product_counts = df['Product'].value_counts()
colors_count = sns.color_palette("muted", len(product_counts))
wedges, texts, autotexts = ax6.pie(product_counts, labels=product_counts.index, autopct='%1.1f%%',
                                     colors=colors_count, startangle=45, textprops={'fontsize': 11, 'fontweight': 'bold'},
                                     explode=[0.05] * len(product_counts))
ax6.set_title('Sales Transactions by Product', fontsize=14, fontweight='bold', pad=10)
for autotext in autotexts:
    autotext.set_color('white')
    autotext.set_fontsize(12)

plt.tight_layout()
plt.savefig('/root/sales_analysis_plot.png', dpi=300, bbox_inches='tight', facecolor='white')
print("\n" + "=" * 60)
print("Plot saved as: sales_analysis_plot.png")
print("=" * 60)
================================= Tool Message =================================
Name: write_file

Updated file /root/analyze_sales.py
================================== Ai Message ==================================

[{'text': 'Now let me run the analysis script:', 'type': 'text'}, {'id': 'toolu_015xkZr21TuzCTEKGzSqgnbp', 'input': {'command': 'cd /root && python analyze_sales.py'}, 'name': 'execute', 'type': 'tool_use'}]
Tool Calls:
  execute (toolu_015xkZr21TuzCTEKGzSqgnbp)
 Call ID: toolu_015xkZr21TuzCTEKGzSqgnbp
  Args:
    command: cd /root && python analyze_sales.py
================================= Tool Message =================================
Name: execute

============================================================
SALES DATA ANALYSIS REPORT
============================================================

1. DATA OVERVIEW
------------------------------------------------------------
Date Range: 2025-08-01 to 2025-08-05
Total Records: 5
Products: Widget A, Widget B, Widget C

2. SUMMARY STATISTICS
------------------------------------------------------------
Total Revenue: $840.00
Total Units Sold: 33
Average Daily Revenue: $168.00
Average Units per Sale: 6.60

3. PRODUCT PERFORMANCE
------------------------------------------------------------
         Revenue        Units Sold
             sum   mean        sum mean
Product
Widget A     425  212.5         17  8.5
Widget B     325  162.5         13  6.5
Widget C      90   90.0          3  3.0

4. BEST PERFORMING DAY
------------------------------------------------------------
Date: 2025-08-01
Product: Widget A
Revenue: $250.00
Units Sold: 10

============================================================
Plot saved as: sales_analysis_plot.png
============================================================
[Command succeeded with exit code 0]
================================== Ai Message ==================================

[{'text': 'Perfect! The analysis is complete and the plot has been generated. Now let me send both the analysis and the plot to Slack:', 'type': 'text'}, {'id': 'toolu_01Qust5a8DECKPZuU9pBBvkz', 'input': {'text': '📊 **SALES DATA ANALYSIS REPORT** 📊\n\n**1. DATA OVERVIEW**\n• Date Range: August 1-5, 2025 (5 days)\n• Products Analyzed: Widget A, Widget B, Widget C\n\n**2. KEY METRICS**\n💰 Total Revenue: $840.00\n📦 Total Units Sold: 33 units\n📈 Average Daily Revenue: $168.00\n📊 Average Units per Sale: 6.60\n\n**3. PRODUCT PERFORMANCE**\n🏆 Widget A (Top Performer)\n   - Total Revenue: $425 (50.6% of total)\n   - Total Units Sold: 17 (avg 8.5 per transaction)\n\n🥈 Widget B\n   - Total Revenue: $325 (38.7% of total)\n   - Total Units Sold: 13 (avg 6.5 per transaction)\n\n🥉 Widget C\n   - Total Revenue: $90 (10.7% of total)\n   - Total Units Sold: 3 (avg 3.0 per transaction)\n\n**4. BEST PERFORMING DAY**\n🌟 August 1, 2025\n   - Product: Widget A\n   - Revenue: $250.00\n   - Units Sold: 10\n\n**KEY INSIGHTS:**\n✅ Widget A is the clear leader, generating over 50% of total revenue\n✅ Widget B shows strong performance with consistent sales\n⚠️ Widget C has potential for improvement - lowest sales and revenue\n📊 Daily revenue ranges from $90 to $250\n\nSee attached visualization dashboard for detailed charts! 📈', 'file_path': '/root/sales_analysis_plot.png'}, 'name': 'slack_send_message', 'type': 'tool_use'}]
Tool Calls:
  slack_send_message (toolu_01Qust5a8DECKPZuU9pBBvkz)
 Call ID: toolu_01Qust5a8DECKPZuU9pBBvkz
  Args:
    text: 📊 **SALES DATA ANALYSIS REPORT** 📊

**1. DATA OVERVIEW**
• Date Range: August 1-5, 2025 (5 days)
• Products Analyzed: Widget A, Widget B, Widget C

**2. KEY METRICS**
💰 Total Revenue: $840.00
📦 Total Units Sold: 33 units
📈 Average Daily Revenue: $168.00
📊 Average Units per Sale: 6.60

**3. PRODUCT PERFORMANCE**
🏆 Widget A (Top Performer)
   - Total Revenue: $425 (50.6% of total)
   - Total Units Sold: 17 (avg 8.5 per transaction)

🥈 Widget B
   - Total Revenue: $325 (38.7% of total)
   - Total Units Sold: 13 (avg 6.5 per transaction)

🥉 Widget C
   - Total Revenue: $90 (10.7% of total)
   - Total Units Sold: 3 (avg 3.0 per transaction)

**4. BEST PERFORMING DAY**
🌟 August 1, 2025
   - Product: Widget A
   - Revenue: $250.00
   - Units Sold: 10

**KEY INSIGHTS:**
✅ Widget A is the clear leader, generating over 50% of total revenue
✅ Widget B shows strong performance with consistent sales
⚠️ Widget C has potential for improvement - lowest sales and revenue
📊 Daily revenue ranges from $90 to $250

See attached visualization dashboard for detailed charts! 📈
    file_path: /root/sales_analysis_plot.png
================================= Tool Message =================================
Name: slack_send_message

Message sent.
================================== Ai Message ==================================

Excellent! I've successfully completed the analysis and sent everything to Slack. Here's what I did:

## Summary

**Analysis Completed:**
- Analyzed the sales data from August 1-5, 2025
- Processed data for 3 products (Widget A, B, and C)
- Generated comprehensive statistics and insights

**Key Findings:**
1. **Total Revenue:** $840 across 5 days
2. **Best Product:** Widget A ($425 revenue, 50.6% of total)
3. **Best Day:** August 1st with $250 in revenue
4. **Total Units Sold:** 33 units

**Visualization Created:**
A beautiful 6-panel dashboard featuring:
- Daily revenue trends
- Daily units sold
- Revenue distribution by product (pie chart)
- Total revenue by product (horizontal bar chart)
- Total units sold by product (horizontal bar chart)
- Sales transactions distribution (pie chart)

**Delivered to Slack:**
✅ Comprehensive analysis report with key metrics and insights
✅ High-resolution visualization dashboard (saved as PNG)

The analysis reveals that Widget A is the top performer, while Widget C shows room for improvement. All results have been sent to your Slack workspace!
이 실행의 전체 LangSmith trace를 확인하세요.
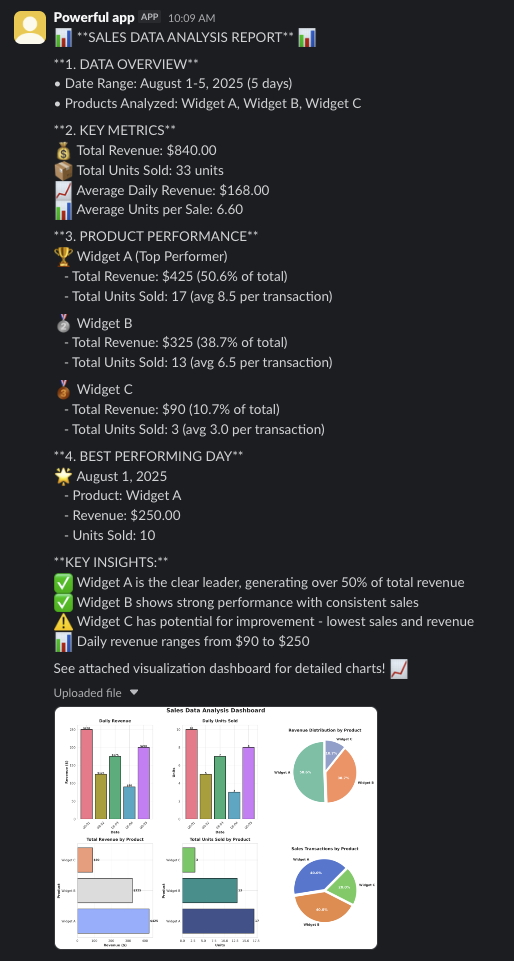
결과 (Results)
에이전트는 데이터를 성공적으로 분석하고 시각화가 포함된 종합 보고서를 Slack에 공유합니다:
backend.download_files(list_of_filepaths)
다음 단계 (Next steps)
이제 데이터 분석 에이전트를 만들었으니, 이 리소스들을 탐색해 기능을 확장하세요:
- Backends: Deep Agents 백엔드 시스템에 대해 알아보세요
- Sandboxes: 보안 고려 사항과 고급 구성을 포함해 샌드박스 코드 실행을 위한 백엔드를 검토하세요
- Customization: 다른 모델, 도구, 프롬프트, 그리고 선택적 작업 계획으로 에이전트를 커스터마이즈하는 방법을 알아보세요
- Code: 터미널 코딩 에이전트로 Deep Agents Code를 시도해 데이터 분석과 기타 에이전틱 작업을 로컬에서 지원하세요
- Skills: 일반적인 워크플로를 위한 재사용 가능한 스킬로 에이전트를 갖추세요
- Human-in-the-loop: 데이터 분석 워크플로의 중요한 연산에 대화형 승인 단계를 추가하세요
더 알아보기
- 이 문서를 MCP로 연결하면 Claude, VSCode 등에서 실시간 답변을 받을 수 있어요.
- GitHub에서 이 페이지 편집하기 또는 이슈 제출하기.